• Hi All

    Please note that at the Chandoo.org Forums there is Zero Tolerance to Spam

    Post Spam and you Will Be Deleted as a User

    Hui...

  • When starting a new post, to receive a quicker and more targeted answer, Please include a sample file in the initial post.

Export specific data

Lenche08

Check this sample version
... I tried to solve those 'small'-values 'myway'.
This should work (again) if Your expected values are between 20 & 100.
What was Your challenge with those Frog's?
I added those to same folder and ... seems to work ... hmm?
 

Attachments

  • WhatIWantToManage.xlsb
    37.2 KB · Views: 2
'myway'.
This should work (again) if Your expected values are between 20 & 100.
And if they're not, as is the case for a shear rate of 500 for example…?
(multiply/divide by 10 until in range?!? - tsk tsk)
 

p45cal

... so far those shear rates has none decimals ...
Just now, it 'take care' only Viscosity-values.
BUT there should be other way to do this ... that's true.

I found one other way
Code:
Workbooks.OpenText FileName:=f, DecimalSeparator:=",", ThousandsSeparator:=" "
For me the result looks same as before
but those csv-file output looks 'better'.

Lenche08

Do those values look now correct?
There should be a chart too ... or how?
 

Attachments

  • WhatIWantToManage.xlsb
    44 KB · Views: 3
Last edited:
And if they're not, as is the case for a shear rate of 500
OK, read:
'And if they're not, as is the case for the viscosity values when the shear rates are 500.'

Those viscosity values are around "19,57” in the CSV file (from what I can remember) which comes out as 195.7 (one hundred and ninety five point seven) instead of 19.57 (nineteen point five seven) in your solution.
(I'll add a picture when I get in front of a computer)
 

p45cal

Okay, I found Your point
There were no challenges with 'Shear Rate'-values.
There were challenges with 'Viscosity'-values.
... which should be between 20...100 ... which is not true ( There are smaller value than 20 ).
BUT
With my the latest version ... I've other solution for those values than *10 or /10.
 
I found one other way
Code:
Workbooks.OpenText FileName:=f, DecimalSeparator:=",", ThousandsSeparator:=" "
Now we're talking.
Much better! Much more robust.
I knew of Workbooks.OpenText but hadn't explored the arguments available; definitely something worth remembering.
Now to get those date/times into Excel date times!;)
 
Hello experts
I am finally home today and now I will get into my problems and your solutions.

Message for Expert001 p45cal
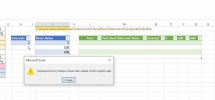
I get some erorr message? What could be wrong? I try it with my files and I get empty results. no results. :confused:

1727719564539.jpeg

Message for Expert 002 vletm
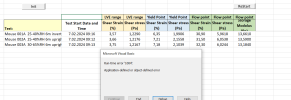
That seems perfect. I test different shear rates and is working perfectly. Dates are correct, results are correct. Decimals and numbers are correct. Very veryy goood. :awesome:
I dont need chart becose I have live image moving and creating charts when I perform that measurments.

1727719817446.jpeg

for Vletm
There were challenges with 'Viscosity'-values.
... which should be between 20...100 ... which is not true ( There are smaller value than 20 ).
With that I mean that must be numbers, smile numbers. like 20 or 100 .not 20.000.....maybe I say that wrong and make confused you. I am sorry.

So my experts?
One question more? Was that very difficult to make? Was that a difficult chalenge to make?

I am without wordssss...you make solution for me in les than 24 hours. I am so happy to see that is working.
In which company are you working boys? You are both genius. I asume that you make magic for your cooworkers in daily routine if they have some problems.

Thank you very much.

I will make some testing more to see if everythink is working...with another csv files, another intervals and so on.
PS: I am total amatour for creating somethink like that? but is that difficult to make? If you will have time can you show me how you make that? where is the code hidden?

Thank you so much again. :awesome:
 

Lenche08

Your I dont need chart...
it's there now, it depends ... what are You looking for? ... do it matter if there are 0.001 difference or 1000?
... am I lucky that I did just add only one chart?

Your #35 reply about 20...100

Your One question more?
If something no work and soon it works without any modifications - it makes challenges.
It was possible to solve ... and same time learn something new.
If there are clear and steady master idea, then many things would be smoother to do.
My sample should have as many intervals and shear rates as needs ... of course there should be data for those too.
I could test only with data I've gotten. There could be some variations which makes unwanted results or so.
 
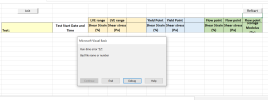
What could be wrong? I try it with my files and I get empty results.
In all the csv files you've given us so far there has been a column called 'Shear Rate' (a header, about 24 lines down, (in line with 'Interval data:" on the left.)
Was there a csv file in the folder that didn't have such an arrangement of data?
 
Hi again
Yes you make all perfect. Are you mathematic guy? Computer guy?

Some queations about the excel final results
If i change the columns shear rate or viscosity? Will the macro still work?
If i delete some line or change the name or move something will macro still work?
Or better
What things I am not alloved to touch?
Thank you
 
hi p45cal
no. All my csv files has shear rate. Is strange. Yesterday your file was working and today not. Hmmmmm

My question in post #61 is for you vletm. I forgot to write it
 
Your
Some queations about the excel final results
If i change the columns shear rate or viscosity? Will the macro still work?
If i delete some line or change the name or move something will macro still work?

Both ifs ... Yes, but the result could be unwanted
Or better
What things I am not alloved to touch?

Your datas layout should be as You've shown to us.
As I've already, written - there are already some variations - those should be okay.
Any code 'works' as it has written - it can be very sensitive.
It's possible to modify code which has more variations ... but those should be know.
There could add options which makes it more smoother to use and get needed results.
Eg there should be note, if something is missing.
 

Lenche08

I continue with some tests ...

There are two sheets for use:

Init:
# [ DeSelect ] - clears selections
# [ Get Files ] - shows ALL possible files in that folder ( ~ You can keep all files there )
# [ Final Results ] - to other sheet ... while changing sheet it reads selected files

Usage:
# If there are new files then press [ Get Files ]
# 'Select' one-by-one those files, which You would like to ... manage.
... Managed files are green.
# press [ Final Results ] ... to manage
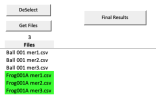
Screenshot 2024-10-01 at 18.23.20.png

Final Results:
# [ Init ] - to other sheet
# [ ReStart ] - sometimes ... happens ... then it needs to 'ReStart'

Usage:
# Make selections with 'Intervals', 'Shear Rates' - as many as needed
# Make selection with 'Results' - one-in-time
# Make selection with 'Chart'-mode
After each selection, You'll get refresh results.

'Interval', Shear rates' and 'Result' are 'fixed' ... (so far).
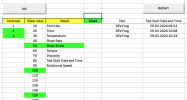
Screenshot 2024-10-01 at 18.23.50.png
'Chart' shows two different modes ...
... still I don't have clear image - what do You manage?

Maybe something like this would be smoother to use than previous version?
 

Attachments

  • WhatYouNeedToManage.xlsb
    81.8 KB · Views: 1
Hello vletm

Ok I will test also this version. Thank you so much for you work.

meanwhile I find something else I need to export...if you can look...I need the same just that this time I need another values.
I will explain you in next post.
 
Hi again
I need the next results:

LVE range- Here we have 2 points but I need only point 1.
Point 1
Values -Shear Strain (%)
Values -Shear stress (Pa)
1727799485070.png

Yield Point
Point 1
Values -Shear Strain (%)
Values -Shear stress (Pa)

1727799427766.png

Flow point
Point 1
Values -Shear Strain (%)
Values -Shear stress (Pa)
Storage Modolus (Pa)

1727799465389.png


See the example in next post.
Thank you very much
 
Here are some examples
 

Attachments

  • Mouse 001A 25-40%RH 6m inverted.csv
    2.7 KB · Views: 2
  • Mouse 002A 25-40%RH 6m upright.csv
    2.7 KB · Views: 3
  • Mouse 003A 30-65%RH 6m upright.csv
    2.7 KB · Views: 2
  • TaskM001.xlsx
    10.1 KB · Views: 1
I just tested your new version- it is excelent. It is perfect.
Is like I am on the software that create that results not in excel. wowwww:awesome:
Very very good.
thank you again :)
 
Back
Top