• Hi All

    Please note that at the Chandoo.org Forums there is Zero Tolerance to Spam

    Post Spam and you Will Be Deleted as a User

    Hui...

  • When starting a new post, to receive a quicker and more targeted answer, Please include a sample file in the initial post.

Export specific data

Hello
Ok I will make some testing ..to see if I will know how to manage to add more then 3 shear rates or only 1 shear rate. I have to learn that.

You make a great work for me. This will really help me to make more faster my work.:awesome:

If you have more ideas how we can improved our excel I am happy to learn it, test it and use it.

Thank you very much. :)
 

Lenche08

Your original need was VBA Macros-solution.

You seems to have some changes with Your original needs.
Here one VBA sample.
#1 Save this sample file in own folder
#2 Save all needed csv-files in same folder
#3 Have needed Intervals and Shear rates in left top of Final Results-sheet
#4 Press [ Do It ]-button
Basically, that's all You need to do.
There can be 'any number' of files, Intervals as well as Shear rates (#3).
( There could be some unwanted features. I cannot test all [im]possible variations. )

>>> Your >>>
Well if is not too much I would like to have both sheets? I was thinking to have two sheets becouse in that way i can make fast check to see if the
data in the FinalResutls sheets are correct?

You can fast check those highlighted rows from ImportedData-sheet. (Actually, there are all datas).
There were differences with csv-files layouts -- basically those should have same layout.

FinalResults-sheet shows my sample layout results.

Your original sheets are still there - that You can compare those.
... Test Start Date and Time ... Are Your values ... verified?
 

Attachments

  • WhatIWantToManage.xlsb
    61.6 KB · Views: 2
Interesting
... for me it works with Your original csv-files.
Do You have same time other excel-files open?
If Yes, then please close those.
Just now, it's only idea which I have now.
 
Yes I dont know why....
First sheet imported data is empty.... when i click it Do it...that sheet goes empty

and the error...that missing files

I do not have other excel open. When I test your excel it was only that excel open.

1727605283879.png
1727605235014.png
 
Yes I dont know why....
First sheet imported data is empty.... when i click it Do it...that sheet goes empty

and the error...that missing files

I do not have other excel open. When I test your excel it was only that excel open.

@vletm's is working here.
Perhaps you've got more than one copy of WhatIWantToManage.xlsb and you're running one that isn't in the same folder as the csv files you're extracting data from? If there are no csv files in that folder you'll get the missing data files error message.
This is just the opposite of my solution. where the workbook with the queries in should be in a different folder! Confusing!

Although with @vletm's here in the UK I'm getting results 1000 times too big mixed with what I think are correct results (the viscosity values' decimal separator in the csv files seems to be a comma):

1727624153505.png

Using
Code:
rx = .Text
seems to work better here in the UK but I'm not sure if that will apply (or will be needed, or even mess things up) in other locales.
 
Last edited:

Lenche08

Few tests ...
#1 Can You move that Your folder? the full length of path and filename seems to be long.
... check Your #10 reply (it's still long path)
#2 Did You test it with Your original csv-files?
#3 Here testing version
... You'll see messages - copy those messages for me.
Based those, I could try to figure - what is going on there?

p45cal

Good to know that somewhere it works.
About those values ...
I wondering those values too.
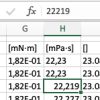
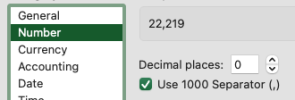
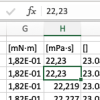
While import those csv's ... I see like below:
'big values'
Screenshot 2024-09-29 at 18.54.44.png Screenshot 2024-09-29 at 18.55.48.png
'small values'
Screenshot 2024-09-29 at 18.54.37.png Screenshot 2024-09-29 at 18.56.03.png

Of course those could show like texts, but I've used to use numbers if (as) those are numbers.

I'll let thinking about those, until I'll know - are those same sizes?
 

Attachments

  • WhatIWantToManage.xlsb
    68.1 KB · Views: 1
Hello experts
about the values yes...it must be around 22 to 100 ( viscosity).
1727627148486.png

If you see 22.000 is not correct.

I am using , in my csv export....

In excel from p45cal if i have . then excel is not working. It must be ,

Ok now I will test your file again vletm.

thank you for your good cooperation
 
First testing vletm... is working but hmmmmm why we have commas? It must be ,

I put both the files and excel in another folder in my C disc.
About messages I get...I must click OK OK OK on every message?
Is not disturbing me....but today I make 300 files ( when I tested p45cal file) and was more friendly.

Now I am thinking maybe we dont need the first sheet...import data... I am thinking that that data I will check on the programe where the data was generated. We only need one sheet ..the sheet with final results.
1727627800047.png
 

Lenche08

... hmm? Previous time it's not working ... and ... not it's working.
Did You change something?
The latest file has 'tst'-option ... that's why 'some' messages.
... if You clear that 'tst'-text away from cell A1 then ... there won't be any those messages.

If it 'works' now,
then I can take away that 'ImportedData-sheet' based Your original need (now there are marked those rows).
.. as well as fix someway those values between 20-100
... ... Your original has always three decimals ( do those need to be numbers or texts? )

About those 'Test Start Date and Time' - are Your correct or mine?

What about There were differences with csv-files layouts -- basically those should have same layout. ?
... are there more variations?
 
What about There were differences with csv-files layouts -- basically those should have same layout. ?
... are there more variations?
Yes now I just find another variation. We still need the same way of extract. For this purpose We need at 5, 100 and 200 shear rate and we have now only 2 intervals.

I have normally 2 variations. ( it depend of project, normally 3 intervals...sometimes 2 intervals).

I am attaching new examples for that. Here we hve 2 intervals. And the excel file I tested today for my 300 files that create p45cal.

If it 'works' now,
then I can take away that 'ImportedData-sheet' based Your original need (now there are marked those rows).
.. as well as fix someway those values between 20-100
Yes it is better to have the final resuls sheet.


... ... Your original has always three decimals ( do those need to be numbers or texts? )
It must be number. That is result for viscosity and must be number.

About those 'Test Start Date and Time' - are Your correct or mine?
The time is correct in your case and my case.

We have only problems with dots and commas. It must be commas.
 

Attachments

  • Frog001A mer3.csv
    13.2 KB · Views: 2
  • Frog001A mer2.csv
    13.3 KB · Views: 2
  • ExpertTestA003a.xlsx
    22.8 KB · Views: 0
  • Frog001A mer1.csv
    13.2 KB · Views: 2
@Lenche08, where are you geographically? Is your Excel using commas as decimal separators and dots as the thousands separator? From your screenshots in msg#36 it looks like it is.
My solution recognises that the values in the csv file uses commas as the decimal separator (because I told it to which is because I recognised that they were (comparing it with the Excel file you attached to your first message here)), but my solution should work in Excel set up in any locale.

edit: I see you've just posted another message and you mentioned that some csv files have only 2 intervals, if the intervals don't start with 1 my query will fail (I was being lazy - work in progress and all that) I'll have a look at that and supply an update later anyway.

@vletm,
When you open a csv file in an Excel set up in a locale which uses a full stop (a period/a dot) as the decimal separator, Excel sees a string such as "22,219" and considers it likely to be a number since the comma is in the right place for being a thousands separator, so ever helpful as Excel tries to be, it converts that value into a number 22219, and while being helpful it also changes the formatting of that cell to show the comma thousands separator.
When it sees a string such as "22,23" it see the comma in the 'wrong' place so keeps the value as a string "22,23".
When you look at the .Value of 22219 it sees no comma so no replacing of the comma with a full stop takes place, but when it looks at the .Value of the string "22,23" it does see a comma so it gets replaced.
If instead of using the .Value property of the cell, you use the .Text property, it sees the comma in both (thanks to Excel's change in the formatting) and does the replacement in both.
How this will behave in Excel set up with a comma as the decimal separator I can only guess. That guess would be that such an Excel would see the commas as the decimal separator and correctly interpret the text in the csv as numbers, and do so consistently, so perhaps no comma replacement would be necessary?

It all stems from Excel being helpful and trying (and failing properly) to interpret csv files when they're opened.
One way round it is to avoid opening the csv files onto an Excel sheet, perhaps reading the file directly into memory (there are several ways) and parsing the intact string data from that before writing the data you want onto a sheet. Quite hard work, but it would be quick.
 
where are you geographically? Is your Excel using commas as decimal separators and dots as the thousands separator? From your screenshots in msg#36 it looks like it is.
Yes my excel is using commas. I am from Europe.

edit: I see you've just posted another message and you mentioned that some csv files have only 2 intervals, if the intervals don't start with 1 my query will fail (I was being lazy - work in progress and all that) I'll have a look at that and supply an update later anyway.

Yes I attached another example. Yes I already try your excel to see if will work but no, I get empty data. No results. I was looking where I can see whee you write from which interval is your query but I didnt find nothing? hmm? I am trying to see what you experts are doing but ohh I am lost in strings. :confused:

If you can manage also for working for 2 intervals it would be really big help for me.

I am very thankfull to you both vletm and p45cal for helping me with my problems. I am copying one by one almost every day and I say ohhh it must be some solution. In my work un such data i cant make mistakes. We have double check on every point every results and that take a lot of time.
If we can manage some faster export then my clicks on copy paste then I only must check the results from the programe that generated the values and with your excel my results and my final reports will be 50% faster and more accurate then my click copy paste solution.
 

p45cal

I tried to test something ...

csv-file looks like below...
Screenshot 2024-09-29 at 20.48.09.png
I can get something like below from csv...
Screenshot 2024-09-29 at 20.42.40.png
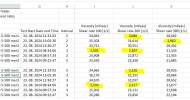
Values like 25,02 align left and
values like 24,889 align right.
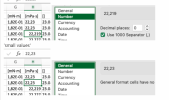
I can get better values with below...
Screenshot 2024-09-29 at 20.41.02.png Screenshot 2024-09-29 at 20.44.49.png

and after above all those values looks for me like below .
Screenshot 2024-09-29 at 20.51.24.png

Lenche08

.. all of those are numbers and those should be okay even with You.
I'll try to test Your latest csv-files later ... after I've cleaned my code.
 
yes
you last scrren shot... is missing some number?

1727632682405.png

so you are working with dots? But when I opened your file i see commas and everything was perfect for me yesterday.
for now you have everything perfect - i am talking about the results that i know what I am expecting to see .
only your last print screen...
 

Lenche08

This is my cleaned version ...
I gotta check again that Your notice too small value case.
Just no, I gotta do something else.
 

Attachments

  • WhatIWantToManage.xlsb
    37.4 KB · Views: 1
For me those look like below with this version:
Screenshot 2024-09-29 at 21.10.52.png
I really gotta go now.
 

Attachments

  • WhatIWantToManage.xlsb
    37.2 KB · Views: 1
Values like 25,02 align left and
values like 24,889 align right.

Yes, and I explained why I think this happens, Excel with dots for decimals can (and does) interpret "24,889" as a number but doesn't recognise "25,02" because the thousands separator is in the 'wrong' place, there should be at least 3 characters after the comma, so it remains a string.
It's this inconsistent (so-called helpful) handling which makes it so hard to work around, which is why I suggest avoiding that helpful behaviour by not putting the csv data straight onto an Excel sheet (which is where the 'helpfulness' occurs) but instead bring the data into memory first and parse it there, then all the values will be strings and you can handle them in the same way.
 
If you can manage also for working for 2 intervals it would be really big help for me.

I'll have a look at that and supply an update later
In the attached, the next version (Chandoo57767WhatIWantToManage_03.xlsx) several changes:
1. This file can be anywhere, even in the same folder as the .csv fles
2. A new table for you to adjust before refreshing the query: at cell H3 a table headed Intervals. These are the intervals to include in the report

Tested on your files, all working properly.

1727639777678.png

ps. Proper tables in Excel have a grab-handle that you can drag with the mouse to adjust the extents of the table. What's counted as being part of the table is only what is within those extents. You can use this to change the contents of the table without actually deleting any values on the sheet.

1727640283821.png

In this next shot, only the 1 and 2 are in the table (and seen by the query):

1727640361160.png

pps. No blank rows in Shear Rates table please! It won't update if there are. I might look at correcting this…
 

Attachments

  • Chandoo57767WhatIWantToManage_03.xlsx
    29.9 KB · Views: 2
Last edited:
Back
Top