Interesting charts. Some good, some not so good, and some which I think are downright deceptive.
For the charts with multiple images (e.g. 2nd row, 3rd column), could use a technique like in the workbook I show here:
http://forum.chandoo.org/threads/insert-shapes-with-a-conditional-statement.15376/#post-92495
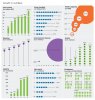
The column charts and "popsicle chart" (2nd row, 1st column) can be created as shown in attached workbook. Top left chart gets a "frowny face" from me for deceptively putting the last column on a different axis. Maked the size comparison wrong.
Middle chart is a bubble chart, and most rubbish of the 9. A simple bar/column chart would have been better. Can't accurately compare circular shapes, and one of the circles has been cut off.
Top right chart is another bubble chart, where (i'm guessing) the size correlates with value. Use some arbitrary picked numbers to position correctly on x and y axis.
Top middle and bottom middle use similar to middle-rigth, but more deceptive, as images aren't even shrunk, so chart length loses meaning. Also, the '20 line is not to scale, with no given indication other than reading number, making this useless.
Bottom right chart is several "waffle charts", using custom images. Not as fancy, but an example of building simple waffle charts is here:
http://datapigtechnologies.com/blog/index.php/building-waffle-charts-in-excel/")