• Hi All

    Please note that at the Chandoo.org Forums there is Zero Tolerance to Spam

    Post Spam and you Will Be Deleted as a User

    Hui...

  • When starting a new post, to receive a quicker and more targeted answer, Please include a sample file in the initial post.

Chart Actual vs Budget

Samir69

New Member
Dear All,

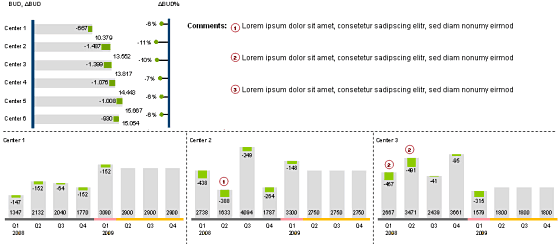
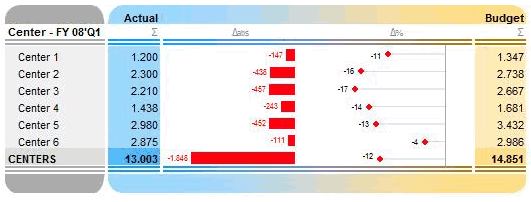
I am interested by the charts #8 and #7 of the link below.

Do you know how i can build the chart which show the variation in % and in absolute value ?

Thanks
budget-vs-actual-Namco.png

budget-vs-actual-cuboo.png


http://chandoo.org/wp/2009/04/05/budget-vs-actual-charts/
 
Samir69

An example of No 7 is shown in the attached
I believe No 8 was done using an Excel addin from the guy who posted the example
 

Attachments

  • Chart 7.xlsx
    13.2 KB · Views: 125
Hello Forum,

Thanks Hui for your proposition. One question how did you integrate the round and how can we color the round in green if we have a positive variation and in red if we have a negative variation ?

Thanks GFC for your very interesting link
 
Hi Samir,

The round are the END type which you can select in more error bar options. As to turining it to green if goes positive, please have a look of attached file. I had used two dummy series to create this chart.

Regards!
 

Attachments

  • chart error.xlsx
    12.6 KB · Views: 67
Hi,

Is there are way to integrate those data tables (Actual/budget) within the graphs, so it looks more like #7? thanks

Inna
 
Hi Sameer69,

May be this chart will help you. Thanks to Faseeh for this chart.
 

Attachments

  • Stacked Bar Chart.xlsx
    13.7 KB · Views: 92
Back
Top