• Hi All

    Please note that at the Chandoo.org Forums there is Zero Tolerance to Spam

    Post Spam and you Will Be Deleted as a User

    Hui...

  • When starting a new post, to receive a quicker and more targeted answer, Please include a sample file in the initial post.

Another Dashboard Finished...

PaulF

Active Member
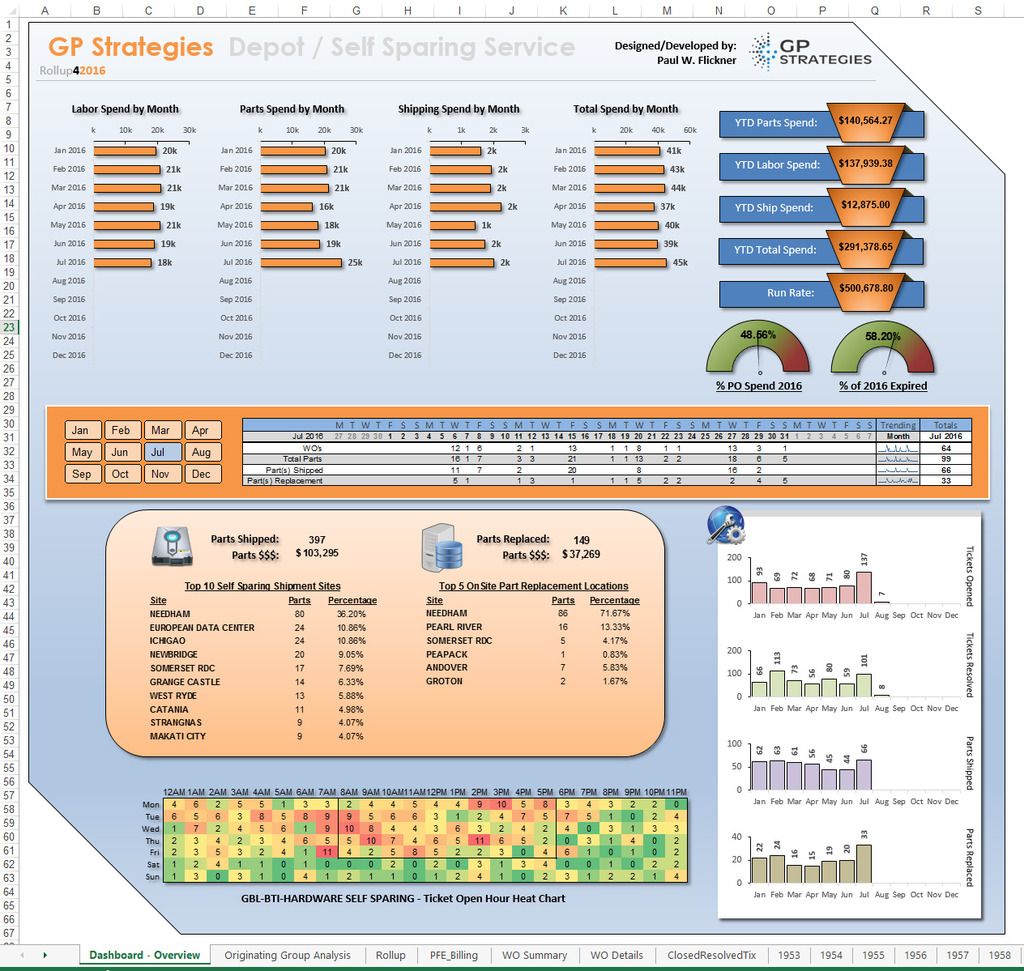
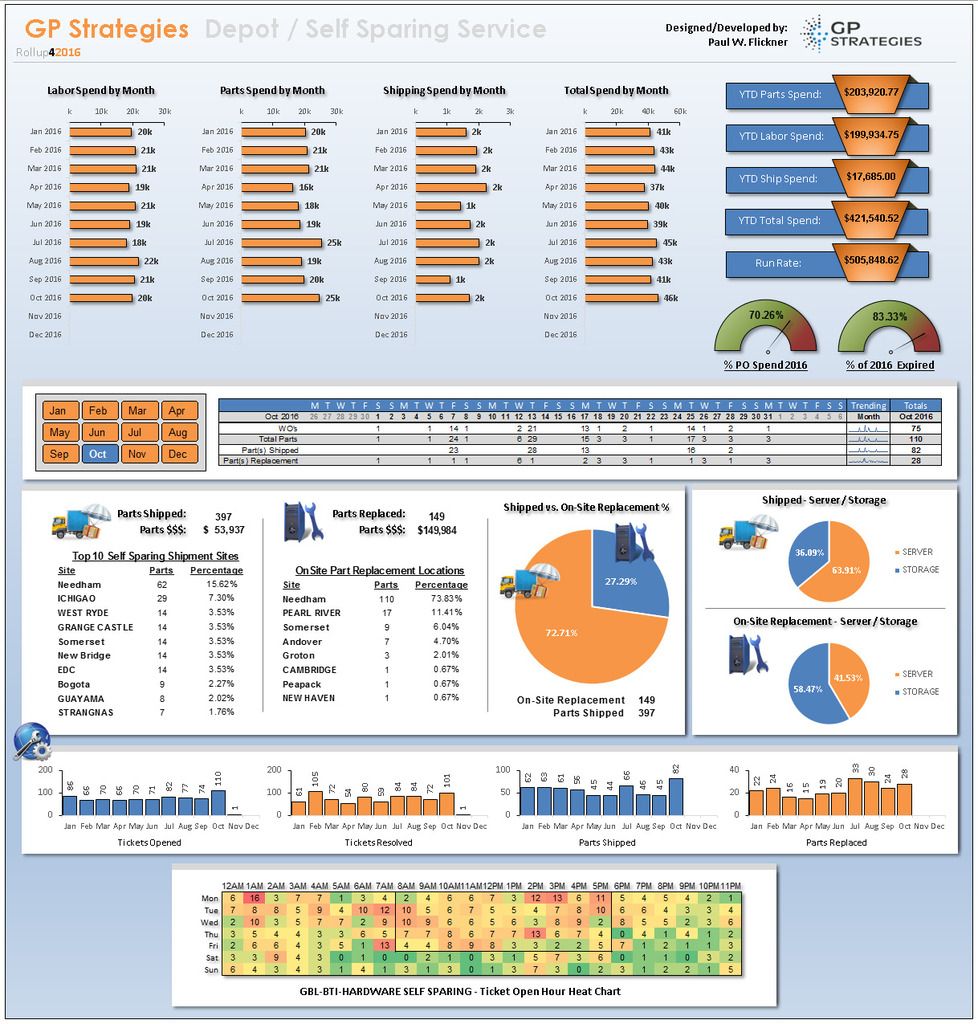
Hundred's of work orders (Invoices each on a separate tab). With the use of Indirect, pivots, rollups via sumif(s), countif(s), and grabbing data from a few sources I can match project hours to work orders, verify and approve payroll, automate expenses for mileage, validate billing, and deliver a detailed summary to the client for signing off of services. I can project run rate against the PO, tell them what model of servers are having the most repairs, isolate activity to platform, O/S, or region on the planet (AMER/EMEA/APAC).

Thank you Chandoo and the folks here in the forms for all of your support.

5.jpg
 
Hi Mr. Pualf,

Am happy to see the format which you had shared here, actually am working in an MNC Compnay and i was joined recently and i want to show dashboard reports and am into Administration department and handling procurement and invoice processing,

Can you please help me out with required format and share me the soft copy of the file..

Thanks,
Venkatesh.
 
Dashboard_zpshsvszqwq.jpg

Still running and looking better with data as the year progresses...
 
I could apply this to our costcoding regime. the past 4 projects have all used SAP and ERP, but the projects are getting tighter with budgets and finding that they don't want to spend on software and are requiring Excel to do the job. I have tried to implement Access but it is time consuming when i am only person who has passable knowledge of the setup. we have over 15 registers all containing daily dockets that contain costings for each area and within those areas their costcoding determines the cost spent on each area of work. Nightmare without a good ERP programme.
 
Charts, colour scheme and icons look very effective, CEOs/MDs will love that.

Similar themes in file attached below, without macros, slicers or pivot tables.
Its just formula in Excel 2003, SQL is a gd principle, maybe there is a simpler way in Excel, but this 3D Dynamic Data Validation is my way.

See Column R to adjust what is displayed on graph. This are more basic or more sophisticated files, but this is a great start.
 

Attachments

  • Calendar#PasswordYrGen.xls
    546.5 KB · Views: 110
  • Like
Reactions: AVK
Here's another good Dash of mine, with Dynamic Charts/Images via Combo Boxes. Real data on UK technical trades aggregated from NOS.

1st tab combo box: P4 & P9. 2nd tab combox boxes: R5, R10 & R20.
File is more useful then images to see how to do your own! You're welcome!

Process.jpg
 

Attachments

  • Process Soc#.xls
    741.5 KB · Views: 81
Back
Top