You are using an out of date browser. It may not display this or other websites correctly.
You should upgrade or use an alternative browser.
You should upgrade or use an alternative browser.
Bell Curve
- Thread starter Lasantha
- Start date
GraH - Guido
Well-Known Member

Hi,
thanks for the reply,
actually i need curved trend line. like attached.
Lasantha.
Attachments
James Carlo Cruz
Member
Hi Lasantha,
In order to have a bell curve like the attached file, your data should be more precise. To get the output you want you need to get the average score and the Standard Deviation for your data.
To get the Average Score or Mean of your data you need to get total score divide by Count of score you may use =Sum(E4:E8)/Count(E4:E8) or simply =Average(E4:E8)
To get the Standard Deviation use the formula =STDEV.S()
Once done, you can write this formula beside the first score :
=NORM.DIST(E4,$H$1,$H$2,FALSE)
Then Insert Scatter graph and choose Scatter with Smooth Lines
I have attached the file that you have sent, but it will not result to a bell curve.
I have created a sample for you. My advise is you have the score data sort it first to lowest to highest.
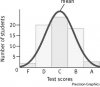
Here is how your bell curve would look like if I use the data you sent

This should be the bell curve would look like

In order to have a bell curve like the attached file, your data should be more precise. To get the output you want you need to get the average score and the Standard Deviation for your data.
To get the Average Score or Mean of your data you need to get total score divide by Count of score you may use =Sum(E4:E8)/Count(E4:E8) or simply =Average(E4:E8)
To get the Standard Deviation use the formula =STDEV.S()
Once done, you can write this formula beside the first score :
=NORM.DIST(E4,$H$1,$H$2,FALSE)
Then Insert Scatter graph and choose Scatter with Smooth Lines
I have attached the file that you have sent, but it will not result to a bell curve.
I have created a sample for you. My advise is you have the score data sort it first to lowest to highest.
Here is how your bell curve would look like if I use the data you sent
This should be the bell curve would look like
Attachments
GraH - Guido
Well-Known Member
I thought already that looked way too simple...Hi,
thanks for the reply,
actually i need curved trend line. like attached.
Lasantha.
 I was going to suggest to look in the analysis tool pack histogram (activate the add-on). But it seems to miss the median curve you are after.
In the mean time some-one else has replied it seems with something that makes sense.
Chihiro
Excel Ninja
Have a read of link. This is how you'd create Histogram with normal curve overlay.
For most charting needs, I find peltiertech.com to be one of best resources.
https://peltiertech.com/histogram-normal-curve-overlay/
For most charting needs, I find peltiertech.com to be one of best resources.
https://peltiertech.com/histogram-normal-curve-overlay/
Hi Lasantha,
In order to have a bell curve like the attached file, your data should be more precise. To get the output you want you need to get the average score and the Standard Deviation for your data.
To get the Average Score or Mean of your data you need to get total score divide by Count of score you may use =Sum(E4:E8)/Count(E4:E8) or simply =Average(E4:E8)
To get the Standard Deviation use the formula =STDEV.S()
Once done, you can write this formula beside the first score :
=NORM.DIST(E4,$H$1,$H$2,FALSE)
Then Insert Scatter graph and choose Scatter with Smooth Lines
I have attached the file that you have sent, but it will not result to a bell curve.
I have created a sample for you. My advise is you have the score data sort it first to lowest to highest.
Here is how your bell curve would look like if I use the data you sent
View attachment 48988
This should be the bell curve would look like
View attachment 48986
Hi James Carlo Cruz,
Thank you very much for this.
Lasantha.
Have a read of link. This is how you'd create Histogram with normal curve overlay.
For most charting needs, I find peltiertech.com to be one of best resources.
https://peltiertech.com/histogram-normal-curve-overlay/
thank you

GraH - Guido
Well-Known Member
")
GraH - Guido
Well-Known Member
Dearly noted!Bell curve isn't really a jargon, but more a layman's term.
Normal Curve/Distribution is a statistical term and Gaussian a mathematical term.
")
View attachment 48993
see attached file
Yes sir, Thank you very much for this.
View attachment 48993
see attached file
Dear Sir,
i am unable to understand following calculation. Could you please explain this to me. (orange colored)
Lasantha.
Attachments

The Mean is 1.99 (~2)
the SD is 0.88 (~1)
so a Normal Curve is 99.7% between -3SD to +3SD
so that is 2 - 3x1 to 2+3x1
= -1 to 5
hence the 5 points on the chart
Dear Sir ,
How you get the -3SD to +3SD
thank you.

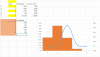
THANK YOUIn the attached I have:
View attachment 49017
It's a nicer fit?
Where:
SD formula swiped from Hui.
- the orange plot is a 5-point scatter plot smoothed (it may be good enough)
- the grey plot is a 40-point scatter unsmoothed
p45cal
Well-Known Member
Mine is normal distribution… isn't it? I hope it is.I assumed op needed normal distribution.
Chihiro
Excel Ninja
I mean I assumed something like link below.
http://hawaii.hawaii.edu/math/Courses/Math100/Chapter4/Notes/Exercises/Prac432.htm
http://hawaii.hawaii.edu/math/Courses/Math100/Chapter4/Notes/Exercises/Prac432.htm