Hi!
I can't figure out how do something that seems conceptually quite straight forward and I'm hoping someone can show me something obvious that I'm missing!
For example. If the variable A has a 60% shared variance score with X and a 5% shared variance score with Y, the position of A on the chart would be plotted at 5% along the Y axis and 60% along the X axis.
I've attached some example data and a mockup of the type of chart I'm trying to create...
It would be great if someone could tell me how to do this in Excel.
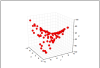
Ideally I would like to add a third variable Z to form an X-axis and make a 3D scatter plot!
Thanks!
I can't figure out how do something that seems conceptually quite straight forward and I'm hoping someone can show me something obvious that I'm missing!
- I have a list of Factors – each has been scored on a nine-point scale on a second list of variables
- I have chosen two of the variables (X and Y) and calculated % shared variance scores between each of those variables and all of the other variables (A, B, C, D etc).
- I therefore have a table with a row each for X and Y, and columns for A, B, C, D, E, etc. In each cell I have a score for the % shared variance that the Factor in the column heading shares with the X (for the X row) and Y (for the Y row).
For example. If the variable A has a 60% shared variance score with X and a 5% shared variance score with Y, the position of A on the chart would be plotted at 5% along the Y axis and 60% along the X axis.
I've attached some example data and a mockup of the type of chart I'm trying to create...
It would be great if someone could tell me how to do this in Excel.
Ideally I would like to add a third variable Z to form an X-axis and make a 3D scatter plot!
Thanks!