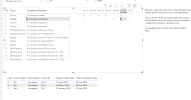
Hi All,
Let me give full context here:
I have:
A disconnected table called, say, MetricTable, with rows like:
# of projects created
# of projects completed
# of projects Inprogress
# of projects Cancelled
A smart DAX measure like MetricValue using SWITCH(SELECTEDVALUE(MetricTable[Metric Name]), ...)
A matrix visual with MetricTable[Metric Name] on rows, YearMonth on columns, and MetricValue in values
the project details are in vwu_process_compliance_data table. I have vwu_process_compliance_data[project created date] and Calendar[date] as inactive relation and vwu_process_compliance_data[project completed date] and Calendar[date] as inactive relation.
This is working fine.
I want to show in another matrix visual in dashboard with project details for the selected metric and month. so, I created another dax called ShowRow, and added this dax > 1 as filter in my matrix visual.
all the metrics and everything works fine, but only for # of projects created and in-progress it does not work.
I tried removefilters(), userelationship(), everything from ChatGPT but none helps. I have the full working PBIx uploaded to check. I have all the dax and data to quickly analyze my issue.
on clicking in table1, on 2 from row # Projects Created of Jan '25, nothing in 2nd table shows, it should show those 2 projects.
on clicking in table1, on 2 from row # Projects Created of Jun '25, it shows up Prj-14, in 2nd table. the other project is missing.
on clicking in table1, on 3 from row # Projects Cancelled of blank column, it shows up Prj-11, Prj-12, and Prj-13, in 2nd table.
completed projects count and details works fine though.
can anyone check and advise, please?

