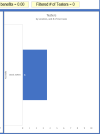
I've created a dashboard, with a chart and slicers.
I'd like the yellow text boxes to update to show values from the chart which of course will change as the user interacts with the slicers.
In the screenshot, the # of testers = 1, and the number of tests = 6.
If I was to adjust the slicer to also include NZ data, then the # of testers would increase to 2, and the number of tests = 10.
The text boxes should update as the chart changes.
NB I'm not using a pivot table as such, just pivot charts

