• Hi All

    Please note that at the Chandoo.org Forums there is Zero Tolerance to Spam

    Post Spam and you Will Be Deleted as a User

    Hui...

  • When starting a new post, to receive a quicker and more targeted answer, Please include a sample file in the initial post.

Stock Trading Profit

AshK

New Member
I am trying to work out the profit on each stock whether sold entirely or partially but I cannot seem to get the number right. In the attached file, the Profit/Loss column is the one I am keen to this right. The result should be as under:
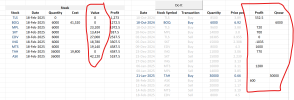
5-Mar-25 Sale:​

  • Sell 8 shares at $160.
    • The first 8 shares come from the 10 shares bought on 01-Feb-25 at $150.
    • Cost of 8 shares = 8 × $150 = $1200.
    • Sale proceeds = 8 × $160 = $1280.
    • Profit = $1280 - $1200 = $80.

15-Apr-25 Sale:​

  • Sell 6 shares at $162.
    • First 2 shares come from the remaining 2 shares at $150.
    • Next 4 shares come from the 5 shares bought at $155.
    • Cost of 6 shares = (2 × $150) + (4 × $155) = $300 + $620 = $920.
    • Sale proceeds = 6 × $162 = $972.
    • Profit = $972 - $920 = $52.
 

Attachments

  • Stock_Tracking_FIFO.xlsx
    12.4 KB · Views: 6

AshK

Could You use something like this in DoIt-sheet?

You'll see totals under 'Stock'.
You could add as many Stock Symbols as needs.
Fill data in columns from I to M as in sample.
Press [ Do It ]-button
N-column shows row 'Buy' profit
O-column shows quantity of row
ref's shows row-number and quantity of selling.


This is still rough sample.
 

Attachments

  • Stock_Tracking_FIFO.xlsb
    29.8 KB · Views: 5
I've tested only with Your given data.
Check this modified version
- eg cannot sell more than has bought.
 

Attachments

  • Stock_Tracking_FIFO.xlsb
    31.8 KB · Views: 7
Thanks a lot. I have nothing but appreciation for your good work. It really works well and can be a great tool. Since I added some data to your previous spreadsheet, I will download the new version and copy it across. A couple of things might make it better. As there is a brokerage cost associated with each trade, a column for that would be great to get a realistic picture of the profit. What is the Value column (F)? Column N and O need to be right aligned. Have a look on the screenshot. Again thank you so much.
 

Attachments

  • Screenshot 2025-02-19 114355.png
    Screenshot 2025-02-19 114355.png
    115.6 KB · Views: 7
Sorry to bother you again. Your improvement was great and it caught one stock where I sold more than what was bought. You can see the TLS stock in the screenshot I sent. The reason was I received some shares as part of dividend reinvestment plan. One option is that we include this as increase on zero value or add an option to reflect DRP. What are your thoughts?
 

AshK

Show Your comments and so
with realistic data with a file.

Here my next sample version.
Click that [ ? ]-cell to hide / show extras.
 

Attachments

  • Stock_Tracking_FIFO.xlsb
    38.3 KB · Views: 8
Last edited:
Thanks. I actually quite liked your previous version. Some formatting and inclusion of profit (alongside cumulative profit you have done will be great)
 
There are all possibilities to do everything.
But
You could get almost same ... after select ?-cell ... as I wrote many days ago.
Screenshot 2025-02-23 at 10.11.29.png
 
Sorry I did not get the alert of your response. You did such a good job that I am using the spreadsheet. This is the one before your last one. Sorry I did not get your message. Be kind to elaborate.
 
Of course, You can use that version too,
BUT
It will give some unwanted results, which has modified with the last version.
 
Thanks. As you said I am getting an error when I sold stock and it still is not dimmed. Do you think I should revert to your last version or would you like me to send you the file.
 
Your Do you think I should ...
As I've written over two weeks ago - check the last line.
It's the latest version.
I've You're getting an error - should I someway guess - what?
I can test only and only with Your given data.
 
Thx. I have attached a copy of the file I am using. TAH stock is not recorded correctly.
 

Attachments

  • Stock_Tracking_FIFO (1).xlsb
    31.5 KB · Views: 1
This is the latest version I transferred the data and I still have the issue with TAH stock.
 

Attachments

  • Stock_Tracking_FIFO2.xlsb
    34.9 KB · Views: 2
Within six days You still cannot show - what should be valid result?
I know grey, but when something is sold?
Is something the issue only with ... TAH?
... because - all of those should solve same way!
 
Thx. First issue is that I don't receive alerts when you respond to me. Not sure what I could do to activate that. That explains the delay in responding to you. I only see your comments if I log back in. I am new in this forum.

Secondly, I profusely complemented your efforts and actually started using the solution. According to your logic, all stocks when they are sold, these are greyed out which is great as others stand out. But In some cases when I bought stocks in part (eg MTS but sold all of them), the Buy lines are still in blue. Similarly, ING is sold but still in blue. This started well up until row 28 of the spreadsheet. The logic was working. After that especially, towards the last rows, it is not behaving as intended. You made such good effort that some helping comments as to what your code does will be helpful. But if I am annoying you, then please let me know and I will try to find solution elsewhere.
 
Alerts:
1) Click Your Member-name top-row of this page
2) Select Account Details
3) Select Email options as You want

Secondly:
It's good to know that someone could use it.
If You're using it then You'll be active to get it work better.
In this time, You could explain where is Your the issue? ... until row 28.
( Pictures would explain more than thousand words. eg something like below )
Screenshot 2025-04-04 at 10.18.48.png
If You'll reread Your previous comments about Your the issue,
do You have now image that someone else would know ... what is Your the issue?
Maybe You could see it with Your eyes and even point it with a mouse.
... that point with expected valid view is a key to find out -
What should modify? ... to show different way?
Can You figure this now?
Especially, all data will take care with same routine.
... if something have to modify, then all already correct results have to get too.
Of course, eg TAH could have own routines.
Without clear indications - what should be correct?
It would be pure guessing - to offer something.

Test this sample versio.
I can test only with given data.
which should cover the most of normal cases.
 

Attachments

  • Stock_Tracking_FIFO2.xlsb
    28.8 KB · Views: 3
Thx. A couple of preferences were unticked. I have now done that.

Appreciate your response. In your latest version you might have fixed the issue but i will need to add more data to see it. Meanwhile, this is what is appearing in the version I am using row 28 onwards to give you an idea.
 

Attachments

  • Screenshot 2025-04-05 101525.png
    Screenshot 2025-04-05 101525.png
    48.6 KB · Views: 2
The file you sent does not have a macro associated with the button so I cannot use or test this version.
 
What were ... unticked?
What have You done ... now?

... might fixed ... what do You mean?
What do You mean ... need to add more data to see it?
I see that You've added more data ... hmm?

Do You mean below [ Do It ]-button or what?
Screenshot 2025-04-05 at 10.11.31.png
I checked my sent file and ... what is missing?
 
I am talking about the preferences in my account you drew my attention to which were unticked but I have ticked these.

The file you sent on Friday does not have any macro associated with the Do It button.
 
Back
Top