• Hi All

    Please note that at the Chandoo.org Forums there is Zero Tolerance to Spam

    Post Spam and you Will Be Deleted as a User

    Hui...

  • When starting a new post, to receive a quicker and more targeted answer, Please include a sample file in the initial post.

Scatter Chart with Dots displaying Spreadsheet Contents

Status
Not open for further replies.

WRB403

New Member
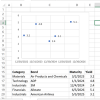
I have a scatter chart with dots that represents information in a spreadsheet. I would like to place my cursor on a particular dot and it would show the contents of a particular cell in the spreadsheet. In the example, I would like to place my cursor on a dot in the chart and the name of the bond (in column C) would appear. When I move my cursor away from the dot, the name would disappear. I do not want to add the names as permanent labels because the chart would become very cluttered with many dots.

Can this be done?

Thank you
81233
 
WRB403
Please reread Forum Rules, which are for You too:
  • Cross-Posting. Generally, it is considered poor practice to cross post. That is to post the same question on several forums in the hope of getting a response quicker.
  • If you do cross-post, please put that in your post.
  • Also if you have cross-posted and get an Solution elsewhere, have the courtesy of posting the Solution here so other readers can learn from the answer also, as well as stopping people wasting their time on your answered question.
 
That appears to be a possible solution. I am far from an expert in Excel so I would need help with a VBA code. Can you offer anything?
Thank you
 
There's a macro blah in the attached which is called when you click Button 1 at cell Q2 in the attached.
It works on what you select on the sheet before you click the button, so select the rows you want plotted from the outlined range K3:M7 and click the button. You don't have to select all the rows and you can select non-contiguous rows.
 

Attachments

  • Chando49281.xlsm
    25.2 KB · Views: 6
Last edited:
I have a scatter chart that has dots on it to show data from a spreadsheet. I want to position my cursor on a specific dot.
 
I have a scatter chart that has dots on it to show data from a spreadsheet. I want to position my cursor on a specific dot.
Please do not hijack other user's threads. If you have a question, you can start a new thread.
 
Status
Not open for further replies.
Back
Top