• Hi All

    Please note that at the Chandoo.org Forums there is Zero Tolerance to Spam

    Post Spam and you Will Be Deleted as a User

    Hui...

  • When starting a new post, to receive a quicker and more targeted answer, Please include a sample file in the initial post.

Power Pivot ... the first Data Model

HI there
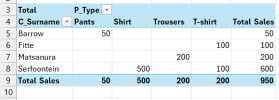
I am new to Power pivot, and i have tried setting up my first Data Model ( attached) and I cannot make it work Althouh i have followed all the instructions that all Yout tube videos give me.
Will you kinldy let me know what seems to be the problem.
Sorry to trouble you. Is a very silly and simple question but i'm stuck
Mant Thanks
Martin
 

Attachments

Can you explain what you are trying to do and what is not working for you. It appears that you have three tables that are linked and you have created a pivot table. Cannot see the source tables, however can see the relationships.
 
The problem was not the relationships (those were set up perfectly) and not the data. The issue was how you placed the field in the PivotTable. You had dragged P_Type into the Values area, which created what is called an implicit measure — "Count of P_Type". Implicit measures in Power Pivot do not filter correctly across table relationships. Instead of following the chain Customers → Orders → Products, it simply counted how many rows existed in the Products table, which gave you 1 for every single cell and 5 as the total (because you have 5 product types). This produced the Cartesian product effect where every order showed every customer with every product.
What we did to fix iT
We replaced the implicit measure with an explicit DAX measure:

Code:
Order Count := COUNTROWS(Orders)

Create the new measure in Power Pivot in the Orders table, save it, and return to Excel. Drag the new measure into the values field and remove the old one.Screenshot 2026-04-05 220617.png
 

Attachments

HI Gateway2026
Thx a lot for your detailed reply.
I have now attached the excel 'source tables' (all sheets).
What concerns me the most is the fact, that i can't get the pivot table ( in sheet1 ) to show the 'simplest' request, which is to show me the Customer that the order is related to. ( It shows all 5 customers against the same order), to start with, ( let alone the orders for each customer that as you say you had to a 'special' measure to get the answer?
So, there is no other way to get the answer unless we create a measure?.
grazie molto.
Martino
 

Attachments

Hi, You always have to create a dax measure.
Code Dax;
Code:
Total Sales := SUMX(T_Orders, RELATED(T_Products[P_Price]))
Then you drag the measurement into the values field. If you want the prices too, drag the p price field into the values field. but the table is stretched horizontally.
 

Attachments

  • Screenshot 2026-04-06 105720.png
    Screenshot 2026-04-06 105720.png
    12.8 KB · Views: 0
  • TESTPowerPivot.xlsx
    TESTPowerPivot.xlsx
    261.8 KB · Views: 2
While SUMX will work, I'd recommend using CALCULATE() here. As SUMX is iterator function and will become inefficient when data size becomes large.

Alternative is to use below, applying T_Orders filter context to the calculation.
Code:
=CALCULATE(SUM(T_Products[P_Price]),T_Orders)
 
Back
Top