• Hi All

    Please note that at the Chandoo.org Forums there is Zero Tolerance to Spam

    Post Spam and you Will Be Deleted as a User

    Hui...

  • When starting a new post, to receive a quicker and more targeted answer, Please include a sample file in the initial post.

Pivot Table: Actual v. Budget Across Multiple Events

KDazed

New Member
Hi,

I am trying to construct a database and pivot table to track actuals v. budget for over a hundred production events, each of which takes place on a different date (i.e. only one event per date).

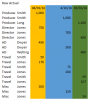
Each event has several expense elements that I am tracking (e.g. Producer, Director, Travel, etc.). As actual expenses arrive, I would like to make an "actuals" entry in my database listing the event date, name of the vendor (e.g. Producer name, Director name, etc.), and the actual amount charged for that particular element.

Ultimately, I would like to have a pivot table that lists each of the event dates across the top, with an actual column and a budget column for each date. Each row would list each of the elements. Each element line would list "Budget" and its associated cost, and the names of the actual vendors and their associated costs, and have an element subtotal.

Each event has one of five different budgets. The issue I am having is building the table (or an actuals table and a budget table) efficiently so that I only have to create a table of five budgets rather than 5x100 budgets.

Any thoughts on designing this? Thanks very much!
 
Hi ,

Rather than concentrate on the application as a whole , can you first put down the data that you can collect for each event ?

List down all the data elements for an event.

Once these elements are listed , see if they can be segregated into independent categories , which can then form the tables.

Also list down all the outputs that you want from this application. We can then see whether these outputs can be derived from the data.

Narayan
 
@KDazed What version of Excel are you using? Depending on version, you might be able to use PowerQuery and/or PowerPivot to do this, by constructing a pivot directly from your relational tables.

As @NARAYANK991 says, it will be much easier for us to suggest approaches if you can provide more information about what data you have to work with. Dummy data is fine.
 
Narayan and Jeffrey, many thanks for your offer of assistance.

The data format is as follows:

There are approximately 100 event dates.

Budget template #1 applies to approximately 15 specific event dates:
4/10/16
4/12/16
5/4/16
7/4/16
...and other dates.
Budget:
Producer Expense $1,000
Director Expense $750
Asst. Director $500
Travel Expense $500

Budget #2 applies to approximately 20 specific event dates
4/11/16
4/13/16
5/5/16
7/9/16
...and other dates.
Budget:
Producer Expense $1,200
Director Expense $900
Asst. Director $500
Travel $500
Equipment $1,000

There are three other budget templates that apply to the other event dates.

As actuals come in, I would enter the following type of info in my actuals table for each invoice that arrives:

Date: 4/11/16
Position: Producer
Name: Smith
Amount: $1,150

The columns of the resulting pivot report would list each of the event dates across the top and each date would have two columns: a budget and an actuals column. The rows would list each of the elements (i.e. Producer, Director, etc.), and the data in the table would be the associated costs. So for the 4/11/16 event, I would see that Smith charged us $1,150 as Producer, and the budget was $1,200, and so on through each of the elements.

I was able to achieve this result when I entered a detailed budget for each event date, but that meant copying budgets for a dozen different elements to over a hundred events -- certainly doable but a bit tedious. I'd love to set up just the five budget templates and link them to actuals through the date, so actuals for the 4/11/16 will compare against the one budget (out of the five budget templates).

I really appreciate your thoughts here. Does this give a little guidance, or would you prefer that I sketch something on a spreadsheet?

Thank you!
 
Hi ,

Do you mean to say that all data related to events will start off with planning ?

Will there never be an event with actual data and without a planned event date ?

What I mean to say is will there ever be an entry in the Actual table without a corresponding entry in any of the Budget Template tables ?

Will the data in the Actual table be related to the entry in the Budget Template tables solely through the event date ?

What if there are two events on the same date ? How do we relate their entries in the Actual table with their entries in the Budget Template table(s) ?

Can you prepare the data in a workbook just putting it all down in a worksheet tab ? Once the data is available all in one place , we can take a look at it and try and compartmentalize it into different tables and see how they relate to one another.

Narayan
 
Hi Narayan,

Thank you for your assistance!

I have uploaded an excel file that lists some sample data. There is a budget tab which holds planned expense for each event (though I only listed a handful of events). There is an actuals tab where I have listed some sample entries. Finally, there is a report tab that indicates the kind of result I am seeking.

I foresee no more than one event per day, so am keying on the date field to pull the tables together.

As I mentioned before, the key for me is to keep my budget table short, so I don't have to create a separate line for each item of each event date. I know I can do it that way, but would be very helpful and efficient to create one budget line per event.

Thank you again for your thoughts.
 

Attachments

  • Sample.xlsx
    14.7 KB · Views: 13
Hi ,

First things first ; I doubt that the report you want will be easy to get using Excel , especially if you want it output each time , without any manual effort.

Such reports are generated by code , and are probably more suited to languages like COBOL !

Any comment ?

Narayan
 
Why do you say that, Narayan? I think this could be whipped up easily enough using PowerQuery and a PivotTable. Or VBA and a PivotTable.
 
@KDazed - You still haven't responded to my previous question: What version of Excel are you using? Depending on version, you might be able to use PowerQuery and/or PowerPivot to do this, by constructing a pivot directly from your relational tables.
 
Why do you say that, Narayan? I think this could be whipped up easily enough using PowerQuery and a PivotTable. Or VBA and a PivotTable.
Hi Jeff ,

PowerQuery and PowerPivot have still caught on , at least for the common Excel user , unless the organizations have embraced them.

As for a pivot table , I am not so conversant with them , and I would be interested to see their usage ; I think , though I may be wrong , that the input tables would need to be redesigned to use pivot tables to get the final report.

VBA is certainly an option , but with the number of dates and the number of names in each category being variable , programming is a bore. I am sure you can whip up the code in a jiffy.

Narayan
 
Hi Narayan,

Apologies for the delay in getting back to you. I am currently using Excel 2016.

While I use Excel on a daily basis, I've never used PowerPivot or PowerQuery, and certainly not VBA. Maybe it's time I learn.

As I mentioned earlier, it's a fairly straightforward, though tedious, exercise if I put in a budget line for each and every event (sample report is attached). Just wish I could lay out the five different budgets once and indicate the dates to which each budget applies. Then have the actuals/budget report for each date grab the appropriate budget.

Thanks to all for your time and input.
 
Hi @KDazed. Can you add into that sample file an example of the raw data that you have to work with? I'm still struggling to work out exactly what your raw data looks like, and so can't advise you how to transform it into your desired end result until I understand a little better what you have to do.
 
Thanks Jeffrey.

I have added budget and actual tabs to give you a idea of the data I am working with.

The data here is abbreviated -- there will likely be over 100 events.

For each event, there will be the five budget lines I list in the Budget tab (i.e. Producer, Director, etc.). There are five budget templates that will be used (i.e. all events will use one of the five templates).

When invoices come in from the Producer, Director, etc., I would like to enter each one individually on a line in the table.

Does that help?
 

Attachments

  • Sample B.xlsx
    20.9 KB · Views: 3
Okay, I'm taking a look at this now. But I probably won't get to it tonight...there is a mountain of dinner dishes to do. If you were in Wellington, New Zealand I'd make you come over here and do them!
 
Okay, still struggling a bit to comprehend your requirements, but it seems to me like you want two things.

Firstly, you want to automatically turn this:
raw budget.png
...into this:
Budget unpivoted.png
Is that correct? That is called unpivoting a crosstab, and I can probably help you out there, if I make some tweaks to some code I have.
 

Attachments

  • Actual.png
    Actual.png
    14.1 KB · Views: 6
Secondly, you want to append actuals tothat table by turning this:

Actual.png

...into this:
Actual unpivoted.png

...with those Home and Visitor rows being filled by matching the date in the Raw Actual data to the dates in the Raw Budget file.

Is that correct?
 
Good morning Jeffrey, and thanks again for your help from so far away!

I apologize for doing a poor job of relating the form of the data I am working with and the result I am seeking. Thanks for your patience.

Referring to your first note, I am not trying to turn the smaller table into the bigger table. I am trying to have just the smaller table of budget figures and avoid having to create that bigger table (which lists every single budget component for every single date). I put the bigger table in there to demonstrate that I could get the report I wanted but I'd have to list every detail for every date.

The same applies to your second note.

Let me take another shot at it.

We produce 100 events per year, each on a different date. Each event has a home team and a visiting team.

We have five different budget scenarios: Scenario A applies to 20 events, Scenario B applies to 20 events, and so on. Each budget assumes expenses for a Producer, a Director, an AD, travel for everyone involved, and miscellaneous expenses.

After the event, the contractors submit to us their invoices for fees, travel, and miscellaneous expenses.

My ultimate goal is to generate a report that shows how each event performed against its assigned budget. So for each date, I would like to see a list of each budget category (Producer fees, Director fees, etc.) with the actual expenses (those submitted by the contractor) and the budgeted expenses that apply to each of the categories. A basic actuals vs. budget report.

The hard part for me is efficiently setting up the budget. I would like to set up my budget table so that I can input each budget scenario only once rather than repeat each budget for each of the 20 events that it applies to. So I'd rather have to input 25 (5 budget scenarios x 5 budget elements) numbers rather than 500 (5 budget elements x 100 events) numbers. The table would assign a specific Budget Scenario to each date. That would be my budget table.

For my Actuals table, as each invoices rolls in from the contractors, I would like to enter a line in a table that indicates the event date on which the service was performed, the name of the contractor, the function of the contractor (Producer or Director or whatever) and the actual amount charged. A quick data input into a table.

Then the Actuals vs. Budget pivot table report would be generated. For each date that an event was produced, ideally, it would look at the budget table to see which Budget Scenario applied to that date, and pull the numbers from that scenario. The next column would look at the Actuals table and pull the names and actual expenses from the associated date. The relative field here is the date. Ultimately, the report would list the date of the event and associated actuals and budget for each of the categories. Event dates at the top of the report and Budget Elements (with actual names when applicable) on the left side of the report.

Does that clarify? I am grateful for your time.
 
I put the bigger table in there to demonstrate that I could get the report I wanted but I'd have to list every detail for every date.

Okay, I understand that. I'm just trying to understand conceptually how this data fits together, and that intermediate table is how a PivotTable will 'see' the data even if we can avoid creating it. (Or we simply might be able to automate the creation of that intermediate table from the separate ones, which is still a win from your current manual approach).


We have five different budget scenarios: Scenario A applies to 20 events, Scenario B applies to 20 events, and so on.

By 'Budget Scenario', I assume you mean something that looks like the 'Raw Budget' table in my earlier post. Are your budget scenarios laid out exactly like that? Or is there some difference. Where are the five different scenarios kept? All in one sheet? All in different sheets? All in different workbooks?

As each invoices rolls in from the contractors, I would like to enter a line in a table that indicates the event date on which the service was performed, the name of the contractor, the function of the contractor (Producer or Director or whatever) and the actual amount charged. A quick data input into a table. Then the Actuals vs. Budget pivot table report would be generated.

Okay. Depending on what version of Excel 2016 you have, it may be possible to go direct from those seperate tables to a PivotTable, or we may have to automate the creation of that intermediate table, create a PivotTable from it, then delete the intermediate table.

Can you click File, then click Account from the bottom right hand side, then take a screenshot of the top right. Here's mine:

Install.png
 
Thank you Jeffrey.

Regarding the Budget Scenarios, each scenario lists the same elements (i.e. Producer, Director, AD, etc.), but the budgeted amounts might be different from one scenario to the next. For example, assumed Producer expense in Budget A might be $1,000 but only $900 in Budget B, depending on who the producer is for the particular dates that the budget applies to.

The raw budget table does accurately reflect our budget layout - though I am not wedded to that format if there is a better route. The budget figures come from a separate analysis that I have in a different workbook. There is no need to link to that workbook -- I am fine with manually inputting the budget numbers into the budget table.

My Excel product information looks exactly the same as yours.

Thanks again!
 
Cool. So just to confirm, under the 'Subscription Product' heading it says "Microsoft Office 365 ProPlus".

It's that ProPlus bit that determines if you have PowerPivot (and possibly PowerQuery) installed.
 
Well this is embarrassing. Now that you point it out, mine is just plain Microsoft Office 365 - not the ProPlus. Could have sworn I looked at it three times. Sorry about that.
 
Yeah, it's easy to overlook that, which is why I asked for a screenshot.

Can you click the Data tab and let me know whether or not there is an area of the ribbon called Get and Transform:

Get and transform.png

I would prefer you take a screen shot of this and post it here.
 
Back
Top