• Hi All

    Please note that at the Chandoo.org Forums there is Zero Tolerance to Spam

    Post Spam and you Will Be Deleted as a User

    Hui...

  • When starting a new post, to receive a quicker and more targeted answer, Please include a sample file in the initial post.

measure for use with slice visor in power bi

adolpo

New Member
hi could you help me
sorry my english is bad
i have a question about of how can i get a measure for use with slice visor

i have a table with status like is showed here

device timeline status
1 10272021 5pm off
1 1027021 2pm off
1 10262021 5pm off
1 10262021 2pm off
1 10252021 5pm on
1 10252021 2pm off
1 10242021 5pm on
3 10272021 5pm off
3 10272021 2pm off
3 10262021 5pm of
3 10262021 2pm on
3 10252021 5pm on

I have created a table called days with values ( 1-3) for refer the days

my idea is to use a slicer visor with a measure using the table called days where only show me only status off device when have 1, 2 or 3 days selected

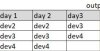
for example if I select :

2 days

the output would be

device
1

if I select

1 days

device
1
3


thanks in advance any sugestion
 
It would help if you upload sample data. Is timeline a string value or is it actual datetime value?

How is your slicer connected to the data?

Without knowing your data structure it is a bit difficult to help.
 
Hello thanks for your help
Yes its a datetime value
For slicer is used a table create called days its a table with numbers 1 -31

Attached data that is used and images from how should be the output

Thanks in advance
 

Attachments

  • data.xlsx
    11.6 KB · Views: 5
  • Output.jpg
    Output.jpg
    45.1 KB · Views: 7
  • Visor.jpg
    Visor.jpg
    16.4 KB · Views: 6
How is your Numbers 1 to 31 related to your data? I see no column that would relate the two.
Are you simply counting day 1 as first date found in record?

As well, in general you can't display output data format in data visual from data model. Unless you transform your table to show each day as it's own column.
 
hello Chihiro
Thanks for your help

I did a table with values 1 - 31 , my purpose is to use something similar to slicer visor to select which days to analyze on the other table (data)

thanks in advance
 
But how are you proposing that you connect that table to your data? Can't really help you without understanding your logic/relationship structure.
 
Hi Chihiro
thanks for assisting me

my purpose is to obtain that devices had the same status (off) depending on the number of days that i choose .
I thought to use a table that refers to days to use it in a visor like slicer .
if there is any other suggestion I would appreciate it
thanks in advance
 
I still don't get your logic... how do you count/calculate from # of days, devices that had same status?

Here's sample that shows # of off status by device in a given day.
 

Attachments

  • data.xlsx
    118.7 KB · Views: 1
hello Chihiro

exactly is the question: how does it count/calculate number # of days, devices that had same status?

using your sample table that shows # of off status by device in a given day .the idea is compare with respect to total rows from that day
after that we have the output like is showed below

Row Labelsdev1 offdev1 tottrue/false dev1dev2 offdev3 tottrue/false dev2dev3 offdev3 tottrue/false dev3dev4 offdev4 tottrue/false dev 4
10/21/2021​
0​
2​
FALSE​
1​
2​
FALSE​
0​
2​
FALSE​
0​
2​
FALSE​
10/22/2021​
0​
2​
FALSE​
0​
2​
FALSE​
0​
2​
FALSE​
1​
2​
FALSE​
10/23/2021​
2​
2​
TRUE​
0​
2​
FALSE​
0​
2​
FALSE​
2​
2​
TRUE​
10/25/2021​
0​
4​
FALSE​
2​
5​
FALSE​
4​
4​
TRUE​
4​
4​
TRUE​
10/26/2021​
2​
3​
FALSE​
3​
3​
TRUE​
3​
3​
TRUE​
3​
3​
TRUE​
10/27/2021​
0​
5​
FALSE​
5​
5​
TRUE​
5​
5​
TRUE​
5​
5​
TRUE​
suppose today is
10/27/2021​
10/27/2021​
10/27/2021​
when select visor slicer 2 3 4
output last N days with all status offdev2
dev3
dev4
dev3
dev4
dev4
 
Back
Top