You are using an out of date browser. It may not display this or other websites correctly.
You should upgrade or use an alternative browser.
You should upgrade or use an alternative browser.
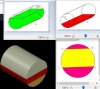
Fuel level in the tank
- Thread starter Matteo
- Start date
Matteo
New Member
Indeed,The 4th one will be relatively easy
Use a stacked column chart and put a cut out shape in front of it
the fourth is to think of being satisfied.
It seems strange to me MS has never added a "horizontal tubes" chart imagining the utility for certain situations
Have a read of
https://chandoo.org/wp/how-to-make-a-5-star-chart/
https://chandoo.org/wp/how-to-make-a-5-star-chart/

Matteo
New Member
I am amazed every day to discover the potential of some programs if used by people like you ...Many things are possible ...
Thanks again ... as soon as I have a draft of what I'm trying to achieve on excel and vba maybe I'll bother you for some advice ....