slightnoob
New Member
Hi there!
I work in compliance for a regulated industry where we process government filings on a set schedule for clients. Most of the items we process renew on an annual basis. This causes significant peaks and valleys in our workflow.
Problem:
We are moving to a business model where all accounts have dedicated account managers that will complete all of that account's work. This is simple enough when looking at total tasks for the year, but the cyclical nature of what we do causes this to be not so straightforward. For example, we have run into an issue in the past where account managers were given a client load with roughly the same amount of total tasks annually, but all of their renewals came up in the same month so that person was either buried or twiddling their thumbs throughout the year. It's hard on our team to have to try and constantly adjust assignments to balance everything out as we go, especially because familiarity with each account is important in our industry.
Desired Outcome:
We have about 140 clients, 5 teams and roughly 65,000 tasks annually. I need a way to manipulate historical task data in a way where Excel will assign accounts to teams so that they have relatively even monthly task loads across all teams each month. Additional criteria includes:
1. Each account management team has a peak of 1,100 tasks per month or less (I'd love to have this graphically represented by a line in a bar chart or something similar).
2. Account management teams have roughly the same volume of tasks annually.
3. Manager has the ability to re-assign certain strategic clients if Excel is automatically placing them with a more junior team.
4. Ability to adjust the number of staff resources we have and still run the calculation.
My ideal scenario is to be able to pull the raw historical data, run the assignments calculation and then have the monthly workload graphically represented in a chart for each account management team. That way it would be easy to see when someone will likely need a little help, when they will have more capacity, etc.
This article from Chandoo looks really close to what I'm trying to get (https://chandoo.org/wp/how-to-distribute-players-between-teams-evenly/), but it does not have the dynamic of monthly fluctuations that all need to be accounted for within the calculation.
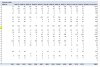
Attached is an example of what the summarized monthly task load by month looks like in a pivot table.
I would love to hear any ideas because this is driving me nuts :D Thanks for reading!
I work in compliance for a regulated industry where we process government filings on a set schedule for clients. Most of the items we process renew on an annual basis. This causes significant peaks and valleys in our workflow.
Problem:
We are moving to a business model where all accounts have dedicated account managers that will complete all of that account's work. This is simple enough when looking at total tasks for the year, but the cyclical nature of what we do causes this to be not so straightforward. For example, we have run into an issue in the past where account managers were given a client load with roughly the same amount of total tasks annually, but all of their renewals came up in the same month so that person was either buried or twiddling their thumbs throughout the year. It's hard on our team to have to try and constantly adjust assignments to balance everything out as we go, especially because familiarity with each account is important in our industry.
Desired Outcome:
We have about 140 clients, 5 teams and roughly 65,000 tasks annually. I need a way to manipulate historical task data in a way where Excel will assign accounts to teams so that they have relatively even monthly task loads across all teams each month. Additional criteria includes:
1. Each account management team has a peak of 1,100 tasks per month or less (I'd love to have this graphically represented by a line in a bar chart or something similar).
2. Account management teams have roughly the same volume of tasks annually.
3. Manager has the ability to re-assign certain strategic clients if Excel is automatically placing them with a more junior team.
4. Ability to adjust the number of staff resources we have and still run the calculation.
My ideal scenario is to be able to pull the raw historical data, run the assignments calculation and then have the monthly workload graphically represented in a chart for each account management team. That way it would be easy to see when someone will likely need a little help, when they will have more capacity, etc.
This article from Chandoo looks really close to what I'm trying to get (https://chandoo.org/wp/how-to-distribute-players-between-teams-evenly/), but it does not have the dynamic of monthly fluctuations that all need to be accounted for within the calculation.
Attached is an example of what the summarized monthly task load by month looks like in a pivot table.
I would love to hear any ideas because this is driving me nuts :D Thanks for reading!