
You are using an out of date browser. It may not display this or other websites correctly.
You should upgrade or use an alternative browser.
You should upgrade or use an alternative browser.
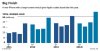
Chart shows 4 quarters in 4 years
- Thread starter Huy Nguyen
- Start date
Somendra Misra
Excel Ninja
Huy Nguyen
New Member
Hi Somendra Misra
Thank you so much for your quick response. I did not expect that someone would get back to me this fast.
I think I wasn't clear in my question. If you take a look at the picture I attached, it shows 4 quarters in 1 year and repeat for other 3 years. Yours shows only Q2 of 4 years. Is it possible to show 4 consecutive quarters in 1 year?
Somendra Misra
Excel Ninja
@Huy Nguyen
OK....See the attached the axis of year is textbox laid over graph and linked to year cells.
Just advise if any issue.
Regards,
OK....See the attached the axis of year is textbox laid over graph and linked to year cells.
Just advise if any issue.
Regards,
Attachments
Huy Nguyen
New Member
Hi Somendra Misra,
This is perfect. Thank you very much. I hope this is not too much to ask but I'm wondering if we can narrow the gap between the years as in the picture? In your graph, I understand that it has one column and we trick Excel to make it look like a gap. But I mean the chart in the picture looks more smooth. I'm just curious. If it's impossible to do, I'm happy with your solution. And thanks again.
This is perfect. Thank you very much. I hope this is not too much to ask but I'm wondering if we can narrow the gap between the years as in the picture? In your graph, I understand that it has one column and we trick Excel to make it look like a gap. But I mean the chart in the picture looks more smooth. I'm just curious. If it's impossible to do, I'm happy with your solution. And thanks again.
Somendra Misra
Excel Ninja
Hi,
Glad you like it. Will get back to you in some time.
Regards,
Glad you like it. Will get back to you in some time.
Regards,
Somendra Misra
Excel Ninja
@Huy Nguyen
See the attached file. Please note this is not a single graph but four graphs allign on the same axis with some text boxes.

Regards,
See the attached file. Please note this is not a single graph but four graphs allign on the same axis with some text boxes.
Regards,
Attachments
Last edited:
Huy Nguyen
New Member
Wow, this looks really neat and natural. It's a great idea to align 4 charts together. I've never thought about this. Thank you very much for your time @Somendra Misra. You rock!!!
Somendra Misra
Excel Ninja
Thanks for your kind words and welcome back anytime.
Regards,
Regards,