Hi All,
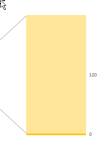
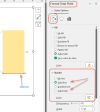
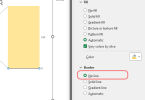
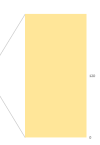
I'm creating a Bar of Pie chart from a data table. In a typical bar or pie chart, I don't see anything represented in the chart area for "0" values. However, in the bar of pie chart, it is showing a small bar piece for my "0" values and I can't figure out how to not have this displayed in the chart. I don't want my users to get confused that there is some amount. In the example below, the dark yellow value at the bottom is "0", but shows up in the bar. Can you help? Thank you!
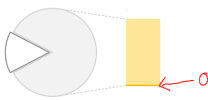
I'm creating a Bar of Pie chart from a data table. In a typical bar or pie chart, I don't see anything represented in the chart area for "0" values. However, in the bar of pie chart, it is showing a small bar piece for my "0" values and I can't figure out how to not have this displayed in the chart. I don't want my users to get confused that there is some amount. In the example below, the dark yellow value at the bottom is "0", but shows up in the bar. Can you help? Thank you!


