• Hi All

    Please note that at the Chandoo.org Forums there is Zero Tolerance to Spam

    Post Spam and you Will Be Deleted as a User

    Hui...

  • When starting a new post, to receive a quicker and more targeted answer, Please include a sample file in the initial post.

Auto Determine for Flat Trend

H.H

New Member
Dears,

Do you have any excel formula/ technique to automatically determine flat trend

Details:
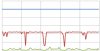
I've to check trend for 485 customer and determine the customer that has flat trend as shown below [red curve]

I don't have raw data for below chart but need to do similar study for hundred users
 

Attachments

  • flat trend.jpg
    flat trend.jpg
    47.3 KB · Views: 11
The easiest method to determine a flat trend is to calculate the slope of the data
you can use the =Slope() function

Slopes of -0.1 to 0.1 are pretty flat, it depends on your needs

If you want any more details, I'd suggest posting a sample file
 
Hi Hui,
Thanks for your reply,
below is sample file
Kindly could you show me how to use Slope function
my X axis is Start Time
Y axis is Variable rate
 

Attachments

  • Sample.xlsx
    9 KB · Views: 3
First add a Chart with 2 series
upload_2017-11-27_13-49-41.png
then add a Trendline to Each series
The first parameter is the Slope

or you can use formula
BUE: =SLOPE(D2:D15,A2:A15)
BAI: =SLOPE(D16:D29,A16:A29)

see attached file
 

Attachments

  • Slope Sample.xlsx
    16.2 KB · Views: 4
Great, Hui
Thanks a lot for sharing
Kindly how did you make Y & X values displayed on the chart be dynamic?
I noticed it update it self each time I change column D Values
 
The charts series are connected to the source data
The Trendline is connected to the Chart series
The Formula are connected to the Trendline

Update the source data and it just flows through
 
Back
Top