You are using an out of date browser. It may not display this or other websites correctly.
You should upgrade or use an alternative browser.
You should upgrade or use an alternative browser.
how to use PowerBi filter top 10 negative number
- Thread starter Oscarr
- Start date
GraH - Guido
Well-Known Member
Hi Oscarr, you show a power query. Why not filter the table?
Filter negative numbers, sort ascending, add an index, filter on index <10 (if index starts from 0).
But remember this is an excel forum, not a powerBi forum.
hi @GraH - Guido
i want filter at outside, like have got button top 3 top 5 top 10..
i thought here can post powerbi, may i know where can post powerbi?
Thanks
GraH - Guido
Well-Known Member
There is a technique "disconnected table", I think you can adopt.
I did not suggest you cannot post anything about PowerBI. I just wanted to point out, that it is perhaps not the best place. Alternative is the offical PowerBI forum from MS. If you consider cross posting, please let us know.
I did not suggest you cannot post anything about PowerBI. I just wanted to point out, that it is perhaps not the best place. Alternative is the offical PowerBI forum from MS. If you consider cross posting, please let us know.
GraH - Guido
Well-Known Member
Chihiro
Excel Ninja
To set to Top/Bottom N filter via Slicer in PowerBI, there are several ways.
Here's one method.
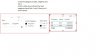
1. Create new table with following formula. Create relationship to original table based on Name column.
2. Create following measures in the original table.
3. Create another table like below.
4. Add measure to TopN_Asc table created.
5. Finally add measure to original table.
Now to set up visual.
1. Add slicer and add TopN column from TopN_Asc.
2. Add Matrix and set up as below.

Here's one method.
1. Create new table with following formula. Create relationship to original table based on Name column.
Code:
RefTable = GROUPBY(Table1,Table1[Name],"Total_Profit",SUMX(CURRENTGROUP(),Table1[Profit]))2. Create following measures in the original table.
Code:
Sum_Profit = SUM(Table1[Profit])
Code:
RankAsc = RANKX(ALL('RefTable'),[Sum_Profit],,ASC)3. Create another table like below.
Code:
TopN_Asc = DATATABLE("TopN",INTEGER,{{3},{5},{10}})4. Add measure to TopN_Asc table created.
Code:
MinTopN = MIN(TopN_Asc[TopN])5. Finally add measure to original table.
Code:
Flag = IF([RankAsc]<=[MinTopN],1,0)Now to set up visual.
1. Add slicer and add TopN column from TopN_Asc.
2. Add Matrix and set up as below.
@Oscarr I think its time we added sub-forums on Power BI, Power Pivot (and rename this one to Power Query).
You can use the approach @Chihiro suggested. Alternatively, you can use the topn filtering natively available in PBI. Just create a measure on which you want to Top N. Put it in the table (or a chart).
Then while keeping the visual selected, click on Filters and choose "Top N" filtering. Use the measure to filter values. Enter N value as you want.
Chihiro
Excel Ninja
@Oscarr
Only time I'd use slicer selection to filter for TopN is when I want to publish to Report/Dashboard/App and when user requests ability to flip between different filter options. Since their access to filter pane is restricted in most cases (1 or 2 admin only).
What @r2c2 wrote is by far most stable method and has better performance, if you are the only user, everyone has filter pane access, or it's being done on PowerBI Desktop.
To set to Top/Bottom N filter via Slicer in PowerBI, there are several ways.
Here's one method.
1. Create new table with following formula. Create relationship to original table based on Name column.
Code:RefTable = GROUPBY(Table1,Table1[Name],"Total_Profit",SUMX(CURRENTGROUP(),Table1[Profit]))
2. Create following measures in the original table.
Code:Sum_Profit = SUM(Table1[Profit])Code:RankAsc = RANKX(ALL('RefTable'),[Sum_Profit],,ASC)
3. Create another table like below.
Code:TopN_Asc = DATATABLE("TopN",INTEGER,{{3},{5},{10}})
4. Add measure to TopN_Asc table created.
Code:MinTopN = MIN(TopN_Asc[TopN])
5. Finally add measure to original table.
Code:Flag = IF([RankAsc]<=[MinTopN],1,0)
Now to set up visual.
1. Add slicer and add TopN column from TopN_Asc.
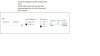
2. Add Matrix and set up as below.
View attachment 50674
hi @Chihiro
that first one create from where? powerbi? can show me pic where to make all that?
i want that results is separate top 3 negative value client and top 3 positive value client...can make that negative and positive button to choose ?
Thanks
Attachments
hi @Chihiro
that first one create from where? powerbi? can show me pic where to make all that?
i want that results is separate top 3 negative value client and top 3 positive value client...can make that negative and positive button to choose ?
Thanks
Hi @Chihiro
So how about this? can you help and make it?
Chihiro
Excel Ninja
To add table just go to Modeling tab and click on New Table and enter the formula.
As for another measure using TopN in descending order. Add measure with following. And follow steps explained in my original post.
Edit: I don't have time to test it now, but I'd imagine it would conflict with the original filter. So you'd need additional logic to turn off the first filter when 2nd slicer is selected and vice versa.
Basically additional IF nested in original flag check.
Or simply do it in separate page.
As for another measure using TopN in descending order. Add measure with following. And follow steps explained in my original post.
Code:
RankDesc = RANKX(ALL('RefTable'),[Sum_Profit],,DESC)Edit: I don't have time to test it now, but I'd imagine it would conflict with the original filter. So you'd need additional logic to turn off the first filter when 2nd slicer is selected and vice versa.
Basically additional IF nested in original flag check.
Or simply do it in separate page.