• Hi All

    Please note that at the Chandoo.org Forums there is Zero Tolerance to Spam

    Post Spam and you Will Be Deleted as a User

    Hui...

  • When starting a new post, to receive a quicker and more targeted answer, Please include a sample file in the initial post.

Idea for a graph Gantt

JOSE COSTA

New Member
Hi everyone,
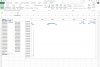
I need of idea to create the Gantt graph with my data of measure of electric energy that I have in data sheet that show me time( rows), hours(column), and filter others values. See the attachment.
The goal main is to show for each day an amount that the D column was different of zero.
Can you help me with this?

Thanks,

Nildo
 

Attachments

  • Memo 25.02.16 22h.xls
    512.5 KB · Views: 9
First grateful for your great help vletm.
I just expressing myself wrong. But I appreciate your help in Minimum-version.
See if you can follow my idea of this picture. The axis line is given in hours of the day.
perfect , I will save numbers like numbers not texts.
Best regards,
Nildo
 

Attachments

  • idea main.jpg
    idea main.jpg
    232.3 KB · Views: 6
People that something incredible Vletm.
I'm very grateful and it was so fast!

But not to abuse their patience i wanted only one thing ... In the last column of the adder active hours for day. For know how much minutes a day are activated.

what function do you use to make this chart? and if I want to change the item reference?

Thank you for now.
Nildo
 
I forgot a detail I need to know how long are activated on range from 7:00 am to 06:00 pm and out of that range. Or other range that i will determine for study.
 
@JOSE COSTA
Which columns tells about active hours for day?
EA+ / EA- ? or which
Needs details, I could add that information ... someway...
and ....
could You send that data again like 'numbers are numbers not text'.
 
@JOSE COSTA
... 7:00 am to 06:00 pm ... with I-column values.
I didn't get straight answer but I tried to do one vision of that...
There are 'gray' (You can change base-color) -areas, which wides depends with I-column values ( I hope that it was 'time'-value ).
If not ... You gotta give proper information to make those.
>> Actually, this is not a chart ...
You can add more data (with correct format, there are no error checking! )
'as much as You want'...
>> Try to test and ask more ...
 

Attachments

  • Memo 25.02.16 22h.xlsb
    136.7 KB · Views: 6
Dear vlertm,

you correct in term of main idea.

Lets try to explain :
I want to know how long during the day I will have the different current zero.
And at night how long will current nonzero .
So I can calculate energy expenditure quanot will spend on average per day and night.

Best regards,

Nildo
whatsapp +5591 98448-1313
 

Attachments

  • image.jpg
    image.jpg
    293.7 KB · Views: 3
@JOSE COSTA
Screen Shot 2016-02-28 at 11.10.32.png
Something like this? 'Every box matters'
Still 'mystery' i-column value ... is it 'time'?
(from 0 to 1; like: 0,25 = 06:00 & 0,5 is 12:00 & 0,75 is 18:00 ) or what?
If You need daily total value, that's possible too.
 

Attachments

  • Memo 25.02.16 22h.xlsb
    140.7 KB · Views: 3
Thank you for your patience

You are on the right way. One hour we hit the idea .
"Mystery": the i- column value is the current value(number) . It serves only to determine whether the equipment is working or not. No need to know the absolute value of this current , but serves information(but keep this field).

I think we just have to count the number of square and so I will have time for each interval ( day and night ) . But this range is now 10 minutes , but may vary for other measure.
I need to know only add up the times for each blue square for interval ( day and night) .I will do for just one days ( 4) for me to try to improve the idea . I'll do it manually and see the formulas that have tried using.

Thanks for the quality,

Nildo
 

Attachments

  • Memo 25.02.16 22h(1).xlsb
    34.5 KB · Views: 1
@JOSE COSTA
You can get needed 'mystery i-column'-values from this link:
http://sunsetsunrisetime.com
even one year calendar!
After that, I can use that information ... interesting?

Just noticed ... You needs blue TIMES (morning, day, evening) ...
Those are possible too ... after I've got daily sunsetsunrisetimes
 
@JOSE COSTA
I get sunset and sunrise times ...
Someway looks that Your daytime is few hours late?
But, it's easy to move left or right.
... check those times ... and let me know how much I should move earlier.
Now, it calculates times too, full 10minutes.
>> I will check that 2nd case later
 

Attachments

  • Memo 25.02.16 22h.xlsb
    163.1 KB · Views: 9
@JOSE COSTA - for testing ...
I moved 'daytime' 5h30m earlier, is it better now?
I also add some 'boxes' over hour-calculations.
'Green' is %/period ( like 05/02 04:10/(18:04:27-05:54:15) )
and 'Red' is time (max 24hrs).
You asked about different range (so far 10min steps).
I tried to make that happen, but I didn't test.
About data,
1) days have to be days! no text!
2) [C] time have to be time! no text!
3) [D] have to be number! no text!
Ideas? ... Questions?
 

Attachments

  • Memo 25.02.16 22h.xlsb
    169.8 KB · Views: 10
Dear vletm,

For me this perfect until here.:) thank you!
Attached a file with range of 2s...o_O for test.
please help me to format this original file(this is my problem).

Best regards,

Nildo
 

Attachments

  • Memo teste medidor kron.txt
    247.4 KB · Views: 2
As field I (column D ) and P (column F ) work together , meaning there will be only P if I exist, I could put in graph the value of P rather than I, because it would be better for me. Replace value I by P...and finished!
 
@JOSE COSTA - a little tricky!
1) You have cut some parts away! There is one rule that it needs previous end next times. I gotta add to 'skip' area two rows that it can calculate 'time step'!
Check those yellow rows.
2) I <> P swap isn't so so simple thing! (I) D-col values will shown in 'output'-sheet as blue boxes height (so far max 1)! (P) F-col values vary so much ...
So, I kept columns in same places and anyway I calculated (P) F-col -values to 'output'-sheet.
>> Ideas ... Questions?
 

Attachments

  • Memo 25.02.16 22h.xlsb
    118.6 KB · Views: 7
Dear vletm please help me to converter this values to read in graph.
I continue missing this conversion format.which field is wrong?
 

Attachments

  • Memo 25.02.16 22h(10 minutos).xlsb
    169.8 KB · Views: 9
  • Memo massa 09.03.2016.xlsx
    291.8 KB · Views: 5
Back
Top