• Hi All

    Please note that at the Chandoo.org Forums there is Zero Tolerance to Spam

    Post Spam and you Will Be Deleted as a User

    Hui...

  • When starting a new post, to receive a quicker and more targeted answer, Please include a sample file in the initial post.

Dynamic Chart Series

MattyNic

New Member
Hi All

I have trawled through numerous forums and websites looking for a way to only have a series/legend appear in a chart if a value exists.

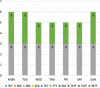
The challenge is that I wish to apply this series in a stacked bar chart. Seven bars exist (Monday-Sunday) and the data series is common across all bars. I wish for the series to disappear if no value appears in a series across Monday-Sunday (image attached)

How might this be possible?

Looking forward to your creative solutions! =)
 

Attachments

  • upload_2016-3-31_12-37-53.png
    upload_2016-3-31_12-37-53.png
    16.3 KB · Views: 10
  • Chart Challenge.png
    Chart Challenge.png
    16.6 KB · Views: 9
MattyNic

Firstly, Welcome to the Chandoo.org Forums

Your problem can only be solved by the use of VBA

You have two approaches

1. To use VBA to edit the chart and remove Legends where there is no data

2. Base the chart on a range in Excel and have the chart constructed or edited based on the values so that only series with values are charted

Either method can be linked to an event so that as data is changed the chart updates accordingly
 
Hi Hui!

Glad to be part of the great Excel forum! Been a long time reader of the Chandoo.org website and thought I'd join the discussions

Thanks for the reference to the link, it works well for a pie chart. However the challenging part is using the dynamic series to represent a stacked column chart =s
 
Hi Hui

Appreciate the help, I have attached a practice file based on the link that you provided earlier. I have also entered simulated data based on what I am wishing to achieve - worked on this all day to no avail!

I only want to see a legend for the corresponding data that is not a zero
 

Attachments

  • Experiment Zero.xlsx
    24.8 KB · Views: 7
Hi Narayan

Appreciate the assistance, can you please apply the VBA mentioned in the above post to my practice file please? I am not skilled at all in VBA!

I can then decrypt and apply to my dashboard =)

Thanks so much!
 
Hi Narayan,

Thank you so much for you assistance! However the chart will be dynamic and once the series are removed and the user selection changes, the series remain absent from the chart. Could you please add one more function so that upon data update (user change), the series will reselect the entire range again?

Thank you so much!
 
Hi Narayan,

Thank you once again for your help, I am just trying to activate the UpdGraphSer macro upon cell change for full automation (reattached with my attempt at VBA). Is it possible to add the reset button and have this CreateGraph macro run across multiple worksheets?

Really appreciate your help!
 
Hi ,

Can you clarify a few points ?

1. I am not able to understand the connection between changing a cell Q3 and anything happening to the chart ; what will be entered in cell Q3 ? How does this data relate to the chart ?

2. I am not able to understand how this macro should be work over multiple worksheets ; will these worksheets have the data in identical locations , and will the charts also be identical ?

Can you upload a file with at least two ( if not more ) tabs , with the data and the charts in them ?

Narayan
 
Hi Narayan,

1. I have five worksheets of data (with five corresponding charts) that are individually called from the dashboard interface (referring to Q3; named range). Charts are stored in their own sheets and a picture link is used to call different charts on ths dashboard. When the user makes a change on the dashboard, this will change Q3 on the respective chart and run the macro to only show series relevant

2. Charts are all identical with the X axis remaining the same across all (Monday-Sunday) and the y axis changing constantly. All data for charts are in the same cells for the five worksheets

I just want to know if there is a way to show the relevant series and then replace them once the user changes the cell Q3 again. I will try to upload some data today
 
Hi ,

Let me understand this :

1. On each of the 5 worksheets , there is only one chart , which will be a stacked column chart.

2. Each of the charts has exactly 5 series , which may or may not be needed. I assume that every chart will have at least one series which will be displayed , since it has at least one non-zero value.

3. When the user interacts with the dashboard , the corresponding chart is to be displayed after the 5 series have been checked and series which have all zeroes have been deleted.

This much is clear.

What is still not clear is what the cell Q3 will contain , and whether every tab will have its own Q3. Or will only the cell Q3 on the dashboard tab control the outcome of the user interaction ?

Will the activation of the relevant worksheet tab be done by some other macro ?

What I can suggest is that we rewrite the UpdateGraphSeries macro to refer to the Activesheet ; we then have a normal Worksheet_Change event macro which activates the correct worksheet.

Then we can have a Worksheet_Activate event macro which calls this UpdateGraphSeries macro.

Thus , there is no need to reset the chart , since when ever the sheet is activated , the macro runs , and ensures that the user gets the correct display.

Narayan
 
Hi Narayan,

Thank you for helping out. Q3 will be a drop down combo box which acts as a dashboard unique caller (1 to call Sheet1, 2 to call Sheet2 etc) for different data sets spanning the five sheets, this unique Q3 will also determine which graph also appears on the dashboard

Unfortunately the five sheets all contain a variable amount of series to make the situation more difficult. Worksheet reference is not done with a macro, rather the indirect function to reference the Q3 on any of the five sheets and perform the call.

With your suggested solution, will the series (which will expand and shrink) automatically reset to display the series reliant on the user selection?

I really hope the attached clarifies my explanation
 

Attachments

  • Experiment Zero (3).xlsm
    49.8 KB · Views: 16
Back
Top