• Hi All

    Please note that at the Chandoo.org Forums there is Zero Tolerance to Spam

    Post Spam and you Will Be Deleted as a User

    Hui...

  • When starting a new post, to receive a quicker and more targeted answer, Please include a sample file in the initial post.

Adding extra data to a chart

abdul bello

New Member
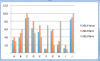
I have a 4-column data as attached. I need to plot columns 1 and 2. After the chart, I need to add to each row of the chart, the values of columns 3 and 4. In other words, besides the chart, I need to create 2 columns to show the values of columns 3 and 4 in such a way that each bar corresponds to the corresponding values in Columns 3 and 4.

Pls. help.
 

Attachments

  • Data.xlsx
    8.7 KB · Views: 7
HI, Something like the attached picture?

IF so, then highlight all the data, and in the chart wizard, select "clustered column" and voila!. As you update the data, the chart will update...
 

Attachments

  • Screen Shot 2014-11-30 at 12.49.13 .png
    Screen Shot 2014-11-30 at 12.49.13 .png
    31.9 KB · Views: 5
Thanks but not exactly. The ranks should not be plotted. I am attaching a sample chart to explain what I really need to do. Let assume my columns 1 & 2 are used to plot the chart. The two other information at the extreme end of the attached chart should represent my columns 3 and 4. How do I go about generating the same chart.
 

Attachments

  • Sample chart.pdf
    358.6 KB · Views: 21
something like this ?
upload_2014-11-30_23-26-2.png

If this isn't right can you please draw a picture of what you want?
 

Attachments

  • Data.xlsx
    11.5 KB · Views: 4
HI Ninja Hui… Take a look at the pdf posted above, its been scanned from a magazine by the looks, and I think was created as a graphic as opposed to an excel chart….
 
Is this what the Original poster is after?
upload_2014-12-1_9-1-49.png
 

Attachments

  • Data.xlsx
    13.4 KB · Views: 3
Hi Abdul ,

Surely this is something that you can try and do yourself. See the uploaded file.

Narayan
 

Attachments

  • Data (1).xlsx
    12.8 KB · Views: 7
Or Right click on the Bubble and add a Data Label
Right click on the Data Label and set the series to Bubble width

You also might try being more specific in future posts about your requirements
upload_2014-12-1_17-23-49.png
 
Back
Top