• Hi All

    Please note that at the Chandoo.org Forums there is Zero Tolerance to Spam

    Post Spam and you Will Be Deleted as a User

    Hui...

  • When starting a new post, to receive a quicker and more targeted answer, Please include a sample file in the initial post.

Use Pivot Table data as a new table

H.H

New Member
Dears,

I've disturbing issue, hopefully you could support me to handle it

I'm handling daily large data that updated each 30 minutes [for hundred of items for tens of information], almost after 1 week or little more my Excel couldn't accept any more new rows

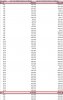
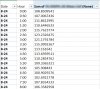
The only solution I find till now, is copy Pivot Table data [sum or average of all my inputs] as shown below 'attachment' and use it as a new table that need Date manual insert and arrange [but definitely very small in size as I've now just sum of all my inputs]
shown below 'attachment'

Kindly any idea, how could I have this process automatically
'may be there's some options or tools that I'm not aware about'
 

Attachments

  • 1Pivot table_sum.jpg
    1Pivot table_sum.jpg
    300.4 KB · Views: 2
  • 2Copy pivot_arraneg manually.jpg
    2Copy pivot_arraneg manually.jpg
    152.6 KB · Views: 1
How many records are you collecting? What is the source of your records? How do they arrive in your worksheet? With a little more information, there's a good possibility that you'll get some usable answers. Off the top of my head, it sounds like something Power Pivot was designed to handle, but it will depend on your starting point for collecting data and your end point for collating and reporting on it.

An example of your file, with anything proprietary sanitized will help greatly. JPGs are not a lot of use, tbh.
 
Looks like a weeks worth of records is ~305,000 rows. Are you trying to summarize them to daily per hour. Excel will not handle much more than that without starting to really slow down, and it's too hard to handle anyhow. Excel is a better Analysis tool than a data storage and manipulation tool at those record numbers, IMHO.

How much time do you want to collect? Months or years or ongoing for longer?
PowerPivot will allow you to work with more data than an excel sheet will hold and it will be faster - if you're not familiar with it, it's a part of Excel that you can imagine holds your data, but the analysis done in the Excel worksheet that you're familiar with. BTW, that's a major oversimplification - it can do all sorts of data calculations that are not open to Excel, but we won't go there now.

You might also think of storing your data in Access; using Access to create a Summary Table and linking your Pivot Table report to that.

By the way try, PivotTable Tools - Design - Show in Tabular form and also Repeat All item labels - that will give you a data table that I *think* you're searching for.

Tell us more about what you want your final report to look like, and elaborate on the time you want to analyze. I have to zoom off to a Board Meeting but will be back in about four hours - in the meantime others will drop in and see this and help out
 
Last edited:
Hi ,

Can you clarify a few points :

1. Your file size is 85 MB ; before I download a file of that size , can you mention its contents ? What does the .rar file contain ?

2. I am not clear about what you wish to do with the data ; you mention that you are creating a pivot table to reduce the size of the data.

If you can explain as comprehensively as possible , what kind of analysis you wish to do , and what kind of outputs you would like to have at the end of the analysis , help would be more accurate.

Off-hand , I can suggest using Power Pivot , which can easily handle file sizes of even 250 MB , and data in tens of millions of rows.

Narayan
 
Hi Dears,
My file size is going to increase every day as it's a historical statistics record..

In my example file [excel], I've already used pivot table/ chart to summarize all my thousand row inputs in one one level statistics Average or Sum [still hourly]
but excel size still huge

what I did before manually [copy pivot table data] into another excel and start arrange it manually 'this is column Day has been filled manually'
below example 2
http://www.mediafire.com/file/qr677evurormepb/Example2.xlsx

[my objective reaching example 2 atomatically]
 
Hi ,

You say your data collection is every 30 minutes ; you say the data in the tab named Sheet1 is a summary of your raw data , but this data too is one entry every 30 minutes. What exactly is the summary that has been done ?

In your latest upload named Example2.xlsx , you have summarized data for the dates September 15 through September 25 ; can you upload the raw data for this sample file , so that we can get an idea of what summarizing has been done , and how it is done ?

Narayan
 
Summarize is Doing Sum/ Average of all thousand inputs using pivot table/chart
as in below example:
*if any row data is still required will upload
Thanks for support, really appreictaed
 

Attachments

  • pivot_sum.jpg
    pivot_sum.jpg
    187 KB · Views: 2
Hi ,

I think the raw data from which you have created your earlier uploaded file Example2.xlsx , will help.

If it is not too much trouble , please upload the raw data.

Narayan
 
Hi ,

Do you mean to say that the raw data for the 10 day period , which is summarized in your file Example2.xlsx , is in compressed form 85 MB ?

Narayan
 
Hi ,

Your raw data file has data in 37 columns ; your pivot table contains only 5 columns ; can you not select only the desired 5 columns before importing the raw data into Excel ?

You can use Power Pivot to do this.

What version of Excel are you using ?

Narayan
 
Do you mean to say that the raw data for the 10 day period , which is summarized in your file Example2.xlsx , is in compressed form 85 MB ?
>>Yes [may be Date could be a little different, I'm just uploading an example of daily routine work]


Your raw data file has data in 37 columns ; your pivot table contains only 5 columns ; can you not select only the desired 5 columns before importing the raw data into Excel ?
>>I'm just trying to make it simple :)
If you want I could upload all again, just let me know

Excel 2013 in business laptop
and 2016 in personal
 
@NARAYANK991 suggestion is a good one - get PP installed and start learning to use it - you'll be able to automate the data input process using it, and you can filter out a lot of the extraneous data - no point in bringing in stuff you don't use.
Once you start using PP to access your data, other areas of improvement in your model will appear, and we'll be happy to help with refining it.
You have an interesting challenge - well I think it is!
 
Thank you all, it seems I'm using pivot in very basic way, will try to proceed with your advices
 
Hi Dears,

This is my update :)
I've separated my row data & my pivot charts
by keeping my raw data in Input.CSV [as it came] and get it into pivot chart by External source
Excel: Data/ From Other source/ From Microsoft Query/ New Data Source/ Microsoft Access Text Driver [*.txt, *.csv]

it was working fine, daily I update my row file Input.CSV
and automatically my pivot chart get updated too

till row data size exceeds two weeks then I couldn't update my input.CSV
anymore

1) is there a solution to let my pivot chart get updated from New input.CSV
[keeping the old trend and get update from new input] ?

2) maybe you have totally different solution ?

excuse me experts, for my long conversation
really appreciate your help, it makes a difference
this problem disturb me a lot..
 
Back
Top