• Hi All

    Please note that at the Chandoo.org Forums there is Zero Tolerance to Spam

    Post Spam and you Will Be Deleted as a User

    Hui...

  • When starting a new post, to receive a quicker and more targeted answer, Please include a sample file in the initial post.

Scrolling Chart

PaulF

Active Member
Hello all,

I have Excel 2013 at home... but have to develop for 2010 at work. That being said with the roll over to 2015 and the desire to have the dashboards span over the calendar year I wanted to show the last 6 months data. Additionally we need to be able to scroll back if needed.

I am SURE there are other and more than likely better ways to do this... but here is my example....
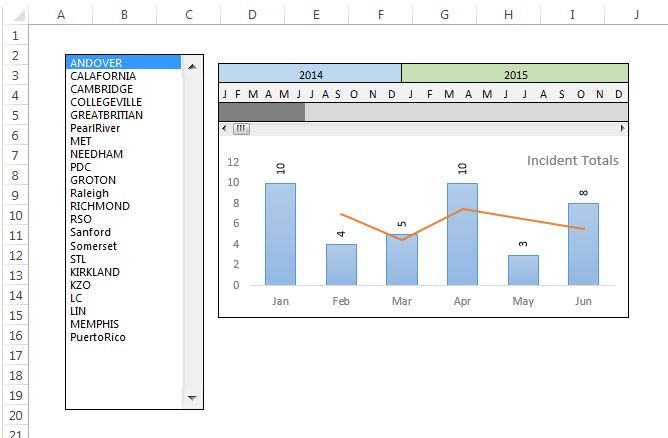
Screenshot_ScrollingChart_zps65ea2f27.jpg
 

Attachments

  • Scrolling_Chart.xlsx
    87.5 KB · Views: 16
Hi Paul,

Nice Graph, but it has some issue, which I think you must address.

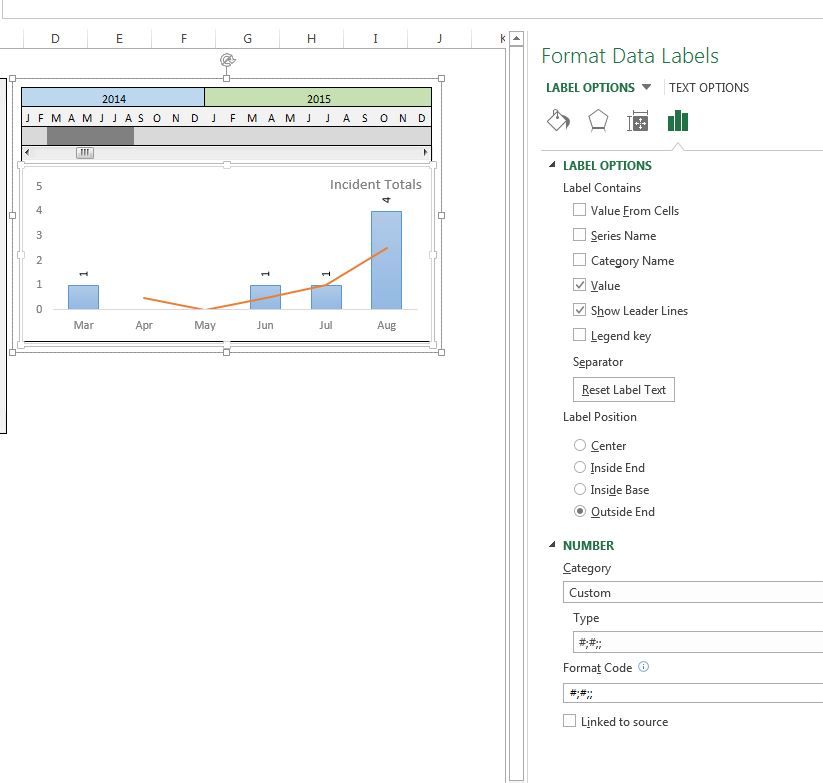
1. Data labels showing 0 for no value, I think you should adjust this with Number format as #;#;; so as 0 is not displayed.

2. You had set Max value for scroll bar as 20 this lead to a 0 in X-axis after Dec 2015, which is not required. So set the Max value to 19.

3. MAJOR issue, value changing with each scroll for a particular month say for May 2015 is showing 5 now you scroll it will change. I think there is a calculation formula issue. Kindly address it.

Correct me if I am wrong and logic or idea is something else.

Regards,
 
I switched to showing 12 months, if I use =Text(Offset($C$9,,D2,,),"#")... I can't seem to graph that data... Remove the Text wrapper and graph bars reappear...
 

Attachments

  • Scrolling_Chart_12Month_1.xlsx
    88.5 KB · Views: 14
Hi Paul ,

See this for an alternative method , provided you can accept a macro-enabled file.

What I have done is :

1. Created a named range Window , which you can set to 6 or 12.

2. Created 2 named ranges X_Axis and Series1 , which have been used in the chart.

3. Ungrouped the Group 1 object , since accessing the Scrollbar maximum value is easier if this is done.

Narayan
 

Attachments

  • Scrolling_Chart_12Month_1.xlsm
    105.4 KB · Views: 46
Hi Paul,

See this file, with all fix.

Regards,

Holy Scnikeys !! Thank you for making me dig and dig to find this... I was wrapping the formula's in =Text and then the data would not chart... I looked everywhere that I knew or or could find... but there it is...
Series_Format_zpsc2d2a993.jpg
 
Back
Top