• Hi All

    Please note that at the Chandoo.org Forums there is Zero Tolerance to Spam

    Post Spam and you Will Be Deleted as a User

    Hui...

  • When starting a new post, to receive a quicker and more targeted answer, Please include a sample file in the initial post.

Polar Scatter graph/Bulls Eye in Excel

daxeman

New Member
Hi,

I am trying to create a scatter graph that shows hole deviation between several drill hole collar locations.

I have the x and y axes values of the design holes as well as the actual drilled holes and I want to compare the deviation between the design drill holes position and the actual drill hole positions.

Appreciate any suggestions or help with my query.
Capture.PNG
 

Attachments

  • Collar_Deviation.xlsx
    161.5 KB · Views: 9
daxeman
Here are three charts.
If any of those didn't match Your needs then try to explain other way.
 

Attachments

  • Collar_Deviation.xlsx
    185 KB · Views: 10
daxeman
Here are three charts.
If any of those didn't match Your needs then try to explain other way.
Hi vletm,

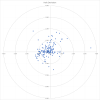
Thank you, I am trying to create a polar scatter plot that shows deviation as a dot on the polar scatter plot.

79372

Shown below is an example of a polar scatter plot that I am trying to replicate.

79371

Thank you for your help.

Regards,
Doug
 
daxeman
It needs two values to get a polar scatter plot - You named ... one.
with Difference- sample ... it looks something same - that I am trying to replicate.
... could You give that plot's data?
with Deviation- sample ... it shows Your original files deviation

Screenshot 2022-06-13 at 09.12.08.pngScreenshot 2022-06-13 at 09.11.50.png
 
In your first attached file, if you were to plot column L (x) and column O (y) you'd have your 'polar' plot.
Your deviation column M I can understand; it's the distance from the target (pythagoras) and contains no angular information. It could help you in colouring the points on the chart, or putting labels on the points indicating their distances from the target.
You have another deviation column with column P although I think you might have that formula wrong (I'm no mechanical engineer) because you root only the first part of the formula, not the whole.
Your formula is:
=SQRT((G3-B3)^2)+((H3-C3)^2)
where the red highighted part is a sqrt directly after squaring, which only serves to return the absolute value of G3-B3, so your formula there can be re-written:
=ABS(G3-B3)+(H3-C3)^2
and I'm not clear on what that value gives you.
For each point I think you only have one deviation (the distance between target hole centre and actual hole centre), so I don't think you need two columns for this.
 
Please see the attached.

Hope that helps!

Regards,
Ken
 

Attachments

  • Collar_Deviation_v2_KenU.xlsx
    60.8 KB · Views: 11
Back
Top