DashboardNovice
Member
On the IBM and the .IBM241004C225 charts, sometimes I can select each of the data series and get the option to plot a secondary axis. I'm not sure what I'm doing to select it the right way.
Anyway, starting on row 52, in the chart "IBM and .IBM241004C225" I'm trying to plot IBM and .IBM241004C225 as candlestick charts, but I can't change .IBM241004C225 to plot on a secondary axis. I can't get the data series selected the right way.
Is it possible to plot two candlestick charts on one graph and use a primary and secondary axis?
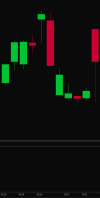
Also, why doesn't the .IBM241004C225 chart look like the attached candlestick chart? The attached chart is from 9/30 to 10/04, showing all 11 candlesticks.
Anyway, starting on row 52, in the chart "IBM and .IBM241004C225" I'm trying to plot IBM and .IBM241004C225 as candlestick charts, but I can't change .IBM241004C225 to plot on a secondary axis. I can't get the data series selected the right way.
Is it possible to plot two candlestick charts on one graph and use a primary and secondary axis?
Also, why doesn't the .IBM241004C225 chart look like the attached candlestick chart? The attached chart is from 9/30 to 10/04, showing all 11 candlesticks.
Attachments
Last edited: