• Hi All

    Please note that at the Chandoo.org Forums there is Zero Tolerance to Spam

    Post Spam and you Will Be Deleted as a User

    Hui...

  • When starting a new post, to receive a quicker and more targeted answer, Please include a sample file in the initial post.

Pivot table with more than one grand total

Costas

Member
Hi Chandoo,

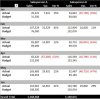
I've set up a pivot table to compare sales by salesperson actual vs budget (see attached photo).
I have two issues:
  • The grand total adds actual and budget values into something that is meaningless to me.
  • The variance % does not show in the grand total but I guess if we fix the first point the second would solve itself.
Thanks
Costas
 

Attachments

  • Pivot table.JPG
    Pivot table.JPG
    54.6 KB · Views: 12
Please post a sample sheet with some data and expected results (pics are nice but allas useless)
 
Hi pecoflyer,

Please see attached excel file. The expected results tab shows what I'd like to see in the pivot table tab.

The main difference is in the grand totals showing totals for actual, budget and variance.

Thanks
Costas
 

Attachments

  • Sales test.xlsx
    42.9 KB · Views: 4
Hi GraH - Guido,

This is what I'm after in the grand totals but I lose the setup I had for each salesperson as per my expected results tab.

Thanks anyway
Costas
 
Hi GraH - Guido,

This is what I'm after in the grand totals but I lose the setup I had for each salesperson as per my expected results tab.

Thanks anyway
Costas
Maybe,

1] Add 2 rows behind "Grand Total" for "Actual" and "Budget"

2] In B31, copied down to B32, then copied/paste to D31:D32 and F31:F32

=SUMPRODUCT(($A$7:$A$28=$A31)*B$7:B$28)

3 In C31, copied/paste to E31 and G31

=(B31-B32)/B32

Regards
Bosco
 

Attachments

  • Sales test(1).xlsx
    43.7 KB · Views: 1
Back
Top