Hi All.
I'll apologize in advance for posting pictures, but unfortunately, I have no way to get data from my work computer to this site, and I don't have Power Bi on my personal computer.
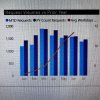
I am trying to chart an average line that excludes the most recent month of data (see chart pic below) - this is because for the last month the processing is not complete (only quickly processed items are complete) which skews the average, so I don't want to include it. As you can see in the chart I achieved the shortened average line effrect I wanted, but the values are wrong...
I used a modified calendar in a new average measure (which excludes July). I have figured out that the modified calendar is having a weird effect on the two measures that are used in the average. I can see they are cumulative (rather than just the current month) and cumulative in reverse (newest to oldest). I'm still fairly new at Power BI so I just can't figure out why this is happening or how to fix it ???
Is there a better method to achieve what I want with the average line, but without sacrificing the July bars in the chart? I am reporting through the end of July, but only want to show the average through June.
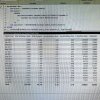
The table visual shows the raw measure values - Total Workdays & Total Requests as well as the Average. Those are followed by my new average calc that I tried with a modified calendar (measure formula shown at top). The last two columns are the two measures used in the average, in the context of the same modified calendar.
I'll apologize in advance for posting pictures, but unfortunately, I have no way to get data from my work computer to this site, and I don't have Power Bi on my personal computer.
I am trying to chart an average line that excludes the most recent month of data (see chart pic below) - this is because for the last month the processing is not complete (only quickly processed items are complete) which skews the average, so I don't want to include it. As you can see in the chart I achieved the shortened average line effrect I wanted, but the values are wrong...
I used a modified calendar in a new average measure (which excludes July). I have figured out that the modified calendar is having a weird effect on the two measures that are used in the average. I can see they are cumulative (rather than just the current month) and cumulative in reverse (newest to oldest). I'm still fairly new at Power BI so I just can't figure out why this is happening or how to fix it ???
Is there a better method to achieve what I want with the average line, but without sacrificing the July bars in the chart? I am reporting through the end of July, but only want to show the average through June.
The table visual shows the raw measure values - Total Workdays & Total Requests as well as the Average. Those are followed by my new average calc that I tried with a modified calendar (measure formula shown at top). The last two columns are the two measures used in the average, in the context of the same modified calendar.