JJ Van niel
New Member
Hello all,
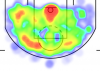
I am trying to make a heatmap based on basketball shot areas. In excel I know you can use conditional formatting to make one that is based on the cells but the chart I have attached is what I am looking for. I'm guessing the chart would have to be done in VBA which is fine and maybe even using objects not a chart.
Essentially, every time a shot is taken from an area that area gets hotter.
Any help on this is greatly appreciated. I have attached an example of what I am trying to do.
Best