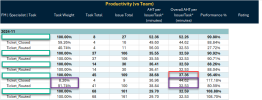
Hi, I have a DAX measure in Power Pivot in Excel that is not quite providing the weighted subtotal I'm looking for. In the image below, I have an Agent (whited out) and which tasks they completed. Based on the Issue Total, I get the Task Weight. The one column that is not working is Overall AHT per Issue/Task (red box). I expect this to be 33.53 based on the team's overall performance (purple box) by ticket closed/routed TIMES the two weights and added together (a sumproduct). The measure I've been trying to correct is below the image and is for the Overall AHT column. When HASONEVALUE is true, it gives the team's AHT (Average Handle Time) by removing the filters on the specialist and their supervisor. This looks to be correctly working, just the subtotal (SUMX) part is not (when HASONEVALUE is false).

=IF(
HASONEVALUE(Productivity[TASK_SUBTYPE]),
CALCULATE(
DIVIDE(
SUM(Productivity[NET_HANDLE_SECONDS]) / 60,
SUM(Productivity[ISSUE_COUNT_FACTOR]),
0),
ALL(Specialists[PREFERRED_FULL_NAME], Specialists[SUPERVISOR_NAME]),
Productivity[SCORECARD_ENABLED] = "Y"
),
SUMX(
Productivity,
CALCULATE(
DIVIDE(
SUM(Productivity[NET_HANDLE_SECONDS]) / 60,
SUM(Productivity[ISSUE_COUNT_FACTOR]),
0) * SUM(Productivity[TASK_WEIGHT]),
ALL(Specialists[PREFERRED_FULL_NAME], Specialists[SUPERVISOR_NAME]),
Productivity[SCORECARD_ENABLED] = "Y"
)
)
)
