You are using an out of date browser. It may not display this or other websites correctly.
You should upgrade or use an alternative browser.
You should upgrade or use an alternative browser.
how to make Colour Arrow in Power Bi
- Thread starter Oscarr
- Start date

Chihiro
Excel Ninja
Not out of the box. Matrix visual only supports Data bar, background fill, and font color for conditional formatting. You'll either have to create your own custom visual, using developer tool.
https://docs.microsoft.com/en-us/po...-visuals-getting-started-with-developer-tools
Or find one that's available, that'll meet your need (from MS market place, most visuals are free).
https://docs.microsoft.com/en-us/po...-visuals-getting-started-with-developer-tools
Or find one that's available, that'll meet your need (from MS market place, most visuals are free).
Not out of the box. Matrix visual only supports Data bar, background fill, and font color for conditional formatting. You'll either have to create your own custom visual, using developer tool.
https://docs.microsoft.com/en-us/po...-visuals-getting-started-with-developer-tools
Or find one that's available, that'll meet your need (from MS market place, most visuals are free).
Hi @Chihiro
Actually got way to make it, just I don know how to make it...
So you have custom visual already imported into your .pbix file?
If you need specific help on how to use custom visual, you'll need to tell us more info, like link to visual in market place.
Upload simplified model/raw data for faster response.
Hi @Chihiro
i got custom visual, but that one don have what i want, because my data got negative and positive....and i saw people can make it without visual...
Attachments
Chihiro
Excel Ninja
I believe the method used is image lookup table, using image url. See link for detail.
http://sqljason.com/2015/11/custom-indicators-in-power-bi-using.html
If you are ok with black up down, there are several ways to do this. If not using direct query mode. I'd recommend following approach.
1. Add index column.
2. Add custom column with following formula.
3. do same for other columns.
4. Remove index column.
5. Add measure [Pdiff]
6. Add indicator measure.

http://sqljason.com/2015/11/custom-indicators-in-power-bi-using.html
If you are ok with black up down, there are several ways to do this. If not using direct query mode. I'd recommend following approach.
1. Add index column.
2. Add custom column with following formula.
Code:
= try [people] - #"Added Index"{[Index]-1}[people] otherwise null4. Remove index column.
5. Add measure [Pdiff]
Code:
Pdiff = SUM(Sheet1[indP])
Code:
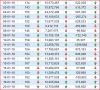
UpDown = SWITCH(True(),ISBLANK([Pdiff])||[Pdiff]=0,"-",[Pdiff]<0,UNICHAR(9660),[Pdiff]>0,UNICHAR(9650))I believe the method used is image lookup table, using image url. See link for detail.
http://sqljason.com/2015/11/custom-indicators-in-power-bi-using.html
If you are ok with black up down, there are several ways to do this. If not using direct query mode. I'd recommend following approach.
1. Add index column.
2. Add custom column with following formula.
3. do same for other columns.Code:= try [people] - #"Added Index"{[Index]-1}[people] otherwise null
4. Remove index column.
5. Add measure [Pdiff]
6. Add indicator measure.Code:Pdiff = SUM(Sheet1[indP])
Code:UpDown = SWITCH(True(),ISBLANK([Pdiff])||[Pdiff]=0,"-",[Pdiff]<0,UNICHAR(9660),[Pdiff]>0,UNICHAR(9650))
View attachment 51588
Hi @Chihiro
Can you try make that profit? Because profit got negative and positive value....
And your recommend that, can make as colour?
Chihiro
Excel Ninja
Just use the same logic for any other column. Nothing changes except for column reference in functions (M and in DAX).
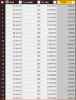
Matrix visual, as far as I know, doesn't support color formats for text/string. If numeric, you could use conditional formatting, but you will lose up-down indicator arrow.
Alternative is to use image uploaded to web, and use image url in table column. Then in modeling set "Data Category" to Image URL.

I don't have image url to give you demo. But if you can supply those url. I could build demo for you.
Matrix visual, as far as I know, doesn't support color formats for text/string. If numeric, you could use conditional formatting, but you will lose up-down indicator arrow.
Alternative is to use image uploaded to web, and use image url in table column. Then in modeling set "Data Category" to Image URL.
I don't have image url to give you demo. But if you can supply those url. I could build demo for you.
Just use the same logic for any other column. Nothing changes except for column reference in functions (M and in DAX).
Matrix visual, as far as I know, doesn't support color formats for text/string. If numeric, you could use conditional formatting, but you will lose up-down indicator arrow.
Alternative is to use image uploaded to web, and use image url in table column. Then in modeling set "Data Category" to Image URL.
View attachment 51594
I don't have image url to give you demo. But if you can supply those url. I could build demo for you.
@Chihiro
Here is imeage website, you can type red down arrow and green up arrow to search
https://www.iconfinder.com/search/?q=Green+up+arrow
Chihiro
Excel Ninja
Here you go...
1. In Home ribbon tool, select Enter Data and create image lookup table:

2. Add index column to original table.
3. Add custom column [Profit_i]
4. Remove unnecessary columns.
5. Back in model, go to created table and set Img URL column to data category "Image URL".
6. Make relationship between [Profit_i] and [UpDown].
7. You'll need to use table visual as Matrix visual does not support image URL.
8. Add columns and you are done.

1. In Home ribbon tool, select Enter Data and create image lookup table:
2. Add index column to original table.
3. Add custom column [Profit_i]
Code:
= if (try [Profit] - #"Added Index"{[Index]-1}[Profit] otherwise 0) > 0 then "Up" else if (try [Profit] - #"Added Index"{[Index]-1}[Profit] otherwise 0) < 0 then "Down" else null4. Remove unnecessary columns.
5. Back in model, go to created table and set Img URL column to data category "Image URL".
6. Make relationship between [Profit_i] and [UpDown].
7. You'll need to use table visual as Matrix visual does not support image URL.
8. Add columns and you are done.
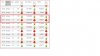
Here you go...
1. In Home ribbon tool, select Enter Data and create image lookup table:
View attachment 51595
2. Add index column to original table.
3. Add custom column [Profit_i]
Code:= if (try [Profit] - #"Added Index"{[Index]-1}[Profit] otherwise 0) > 0 then "Up" else if (try [Profit] - #"Added Index"{[Index]-1}[Profit] otherwise 0) < 0 then "Down" else null
4. Remove unnecessary columns.
5. Back in model, go to created table and set Img URL column to data category "Image URL".
6. Make relationship between [Profit_i] and [UpDown].
7. You'll need to use table visual as Matrix visual does not support image URL.
8. Add columns and you are done.
View attachment 51596
@Chihiro
that Arrow is not correct, and some Error there, if i add next day data got same value duplicate, there cant load it out...i think is no put same value formula equal (right Arrow)....
Attachments
Here you go...
1. In Home ribbon tool, select Enter Data and create image lookup table:
View attachment 51595
2. Add index column to original table.
3. Add custom column [Profit_i]
Code:= if (try [Profit] - #"Added Index"{[Index]-1}[Profit] otherwise 0) > 0 then "Up" else if (try [Profit] - #"Added Index"{[Index]-1}[Profit] otherwise 0) < 0 then "Down" else null
4. Remove unnecessary columns.
5. Back in model, go to created table and set Img URL column to data category "Image URL".
6. Make relationship between [Profit_i] and [UpDown].
7. You'll need to use table visual as Matrix visual does not support image URL.
8. Add columns and you are done.
View attachment 51596
@Chihiro
is this possible to use Matrix with this color Arrow? i saw at this people are use Matrix with color Arrow...
this is that pbix file
https://onedrive.live.com/?authkey=...99&id=B8DF7839DBA25B99!111&parId=root&o=OneUp
Chihiro
Excel Ninja
You didn't follow my instruction it looks like. Relationship should be based on UP/Down value only. Not on buy.
Matrix is no go, as this visual does not support image or text color formatting. Where ever you saw the report, ask them how it's made. I suspect they used another workaround. Sample image you had in your file is table visual and not matrix.
One alternative that may work, if you have Power Query & Power Pivot in Excel, is to create basic measures, KPI, and models in Excel. Then use PowerBI to import Excel workbook contents.
However, this partially negates benefit of using PowerBI and I'm not fan. Do a google search and you should find some articles on it.
Last edited:
Chihiro
Excel Ninja
that Arrow is not correct
Hm? My sample matches exactly your sample file. If something went wrong then restart and follow my instruction carefully.
Hm? My sample matches exactly your sample file. If something went wrong then restart and follow my instruction carefully.
I try so many time your instruction, still same that arrow is not correct, Can you screenshot all your step?
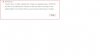
And another problem is, when I add new data in excel refresh power bi, if there a same value with another day, then that data can’t load See error 2 pic...
Example:
1-1-2018 people 188
18-3-2018 people 188
Chihiro
Excel Ninja
That's not an issue. Your issue, is that you are not using the custom column created, [Profit_i], as related column to [UpDown].
You are using value column [Buy] to create relationship, which should never be done.
Also note that relationship should be Many to 1 or 1 to Many.
As well, tables can have only one active relationship. If using same image lookup table as related table for 3 columns in the table, you'll need to use USERRELATIONSHIP in your DAX to override active relationship when necessary.
But this is more to do with how to build your data model rather than how to use indicator in your visual. I'd suggest, you start by going through the article below.
https://docs.microsoft.com/en-us/power-bi/guided-learning/modeling