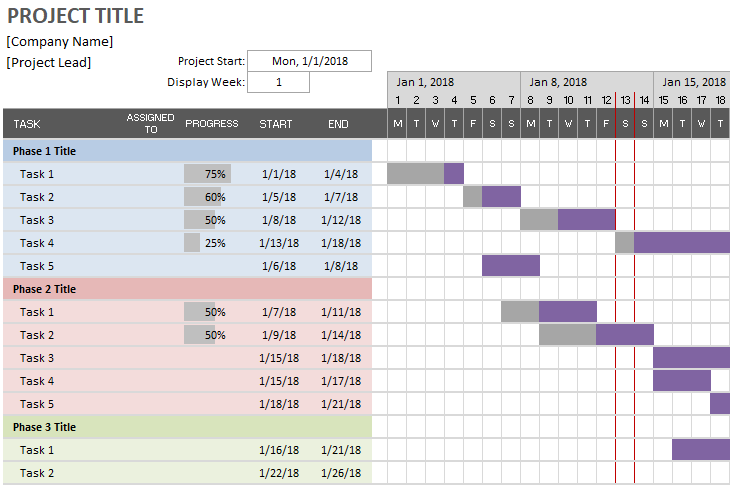
Hi. I found Gantt chart templates in excel and online that use the dates with conditional formatting to display these time periods as bars in the respective rows. I want to do the reverse. I would like to indicate cells in the specific row that will represent this time period. Excel must then recognize what dates are indicated and update the start and end date. Just I indicated with the red arrows below. Has anyone seen a solution for this problem? Thank you. Dirk