PaulF
Active Member
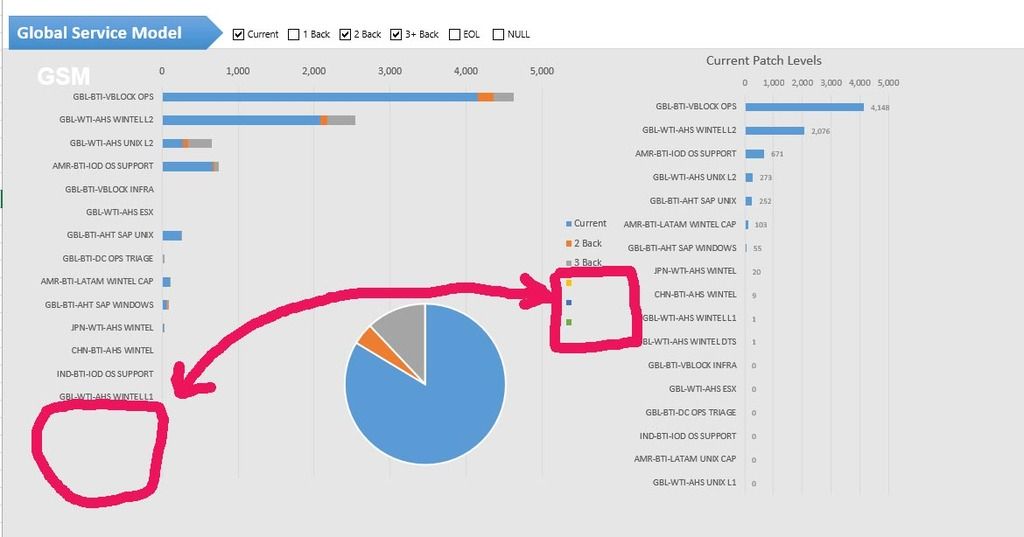
I'm trying to create a dynamic chart and maybe I'm going about this the wrong way...
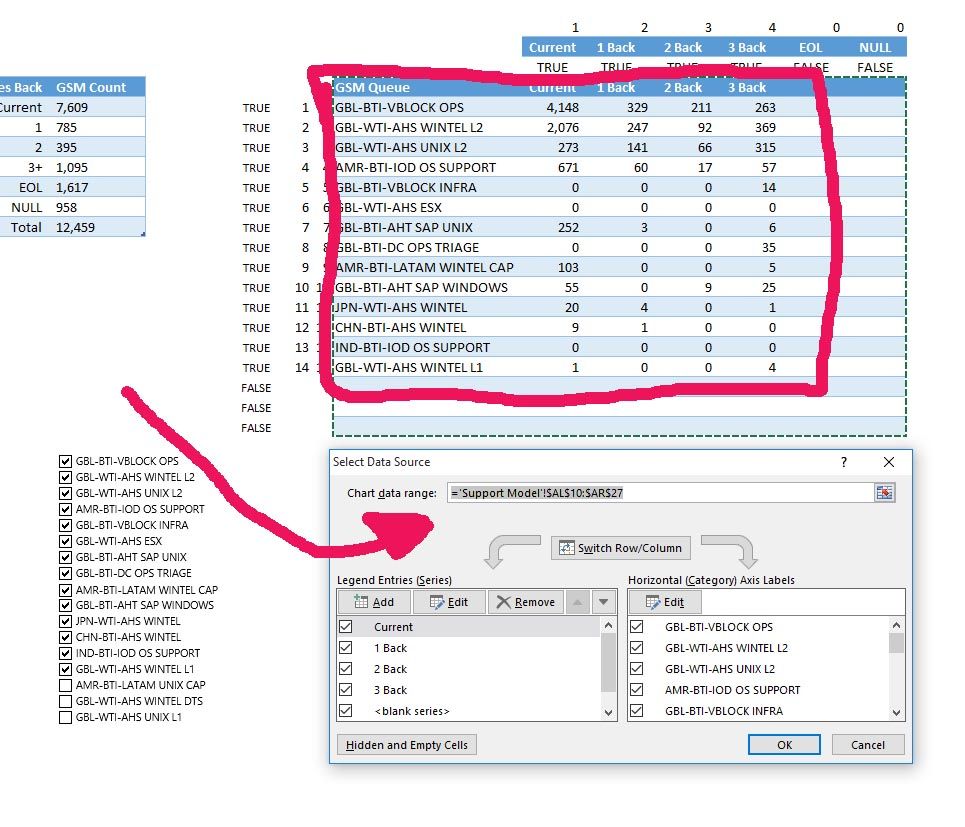
I have some checkboxes that will allow you to choose Groups (Ticket Queues) on the left and select from 4 columns to view how many patch sets back these servers are and 2 columns for blank or EOL (End of Life).
I can use offest functions and vary the row depth and/or column width, but the chart will end up with some blank rows or columns...
I can't seem to be able to put in a formula for the Chart Data Range ??
Am I on the right path or ??
=OFFSET('GSM Dashboard'!AM$20,,,17-COUNTBLANK('GSM Dashboard'!AM$20:AM$37),7-COUNTBLANK('GSM Dashboard'!AM$20:AS$20))


