Hi All,
Context:
I am working on process performance comparison dashboard in PowerBI. I have metric measurements for TAT, FTR, Efforts and Iterations.
EffortMeasure = ROUND(AVERAGE(ProjectData[Total Actual Efforts]), 1)
FTRMeasure = FORMAT(ROUND(DIVIDE(SUM(ProjectData[FTR Yes Tasks count]), SUM(ProjectData[Total Review Tasks in first submilestone]), 0), 1), "0.0%")
TATMeasure = ROUND(AVERAGE(ProjectData[TATinDays]), 1)
IterationMeasure = ROUND(Average(ProjectData[Iteration Count]), 1)
Based on Date column in my data, in my PowerQuery I have created two columns - "Baseline_MonthlyPerf" and "CompMonths" grouping customized to business requirements. These two columns have text data type.
The values under these columns are as follows:
Baseline_MonthlyPerf
<ToFY'23
FY'24BL
FY'25HY1
FY'25HY2
CompMonths
<ToFY'23
FY'24BL
Apr-24
May-24
Jun-24
Jul-24
Aug-24
Sep-24
Oct-24
Nov-24
Dec-24
Jan-25
What I have done so far:
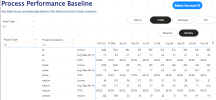
I have placed a matrix table with CompMonths or Baseline_MonthlyPerf as headers (under columns) based on Field Parameter.
I have placed the above said metric measures in values of matrix and set display as rows.
I have few meta data like Account Name, Asset Type as some filters, and project complexity under Rows of matrix visuals.
This shows and works perfectly as expected in Matrix visual. Attached is example screenshot of my dashboard layout.
Pic1 shows when Baseline_MonthlyPerf and TAT is selected
Pic2 shows when CompMonths and FTR% is selected.
Next Help Required:
1. Baseline_MonthlyPerf Comparison: When the Matrix visual displays Baseline_MonthlyPerf as headers, calculate the differences between FY'24BL and FY'25HY1, and FY'24BL and FY'25HY1 for each metric.
FY'24BL serves as the base column and won't be compared.
2. CompMonths Comparison with Icons: When CompMonths is displayed as headers, show an icon indicating whether the metric for a month is improving, worsening, or unchanged compared to the column on its left. Example:
May-24 should have icon based on comparison with Apr-24
Jun-24 should have icon based on comparison with May-24
Apr-24 serves as the base column without any comparison. In the Pic2, you can ignore <ToFY'23 and FY'24BL column. I can filter-out if required.
Remember:
The Baseline_MonthlyPerf and CompMonths are text data type.
I am new to PowerBI and DAX, hence request if you can provide more detailed steps.
Context:
I am working on process performance comparison dashboard in PowerBI. I have metric measurements for TAT, FTR, Efforts and Iterations.
EffortMeasure = ROUND(AVERAGE(ProjectData[Total Actual Efforts]), 1)
FTRMeasure = FORMAT(ROUND(DIVIDE(SUM(ProjectData[FTR Yes Tasks count]), SUM(ProjectData[Total Review Tasks in first submilestone]), 0), 1), "0.0%")
TATMeasure = ROUND(AVERAGE(ProjectData[TATinDays]), 1)
IterationMeasure = ROUND(Average(ProjectData[Iteration Count]), 1)
Based on Date column in my data, in my PowerQuery I have created two columns - "Baseline_MonthlyPerf" and "CompMonths" grouping customized to business requirements. These two columns have text data type.
The values under these columns are as follows:
Baseline_MonthlyPerf
<ToFY'23
FY'24BL
FY'25HY1
FY'25HY2
CompMonths
<ToFY'23
FY'24BL
Apr-24
May-24
Jun-24
Jul-24
Aug-24
Sep-24
Oct-24
Nov-24
Dec-24
Jan-25
What I have done so far:
I have placed a matrix table with CompMonths or Baseline_MonthlyPerf as headers (under columns) based on Field Parameter.
I have placed the above said metric measures in values of matrix and set display as rows.
I have few meta data like Account Name, Asset Type as some filters, and project complexity under Rows of matrix visuals.
This shows and works perfectly as expected in Matrix visual. Attached is example screenshot of my dashboard layout.
Pic1 shows when Baseline_MonthlyPerf and TAT is selected
Pic2 shows when CompMonths and FTR% is selected.
Next Help Required:
1. Baseline_MonthlyPerf Comparison: When the Matrix visual displays Baseline_MonthlyPerf as headers, calculate the differences between FY'24BL and FY'25HY1, and FY'24BL and FY'25HY1 for each metric.
FY'24BL serves as the base column and won't be compared.
2. CompMonths Comparison with Icons: When CompMonths is displayed as headers, show an icon indicating whether the metric for a month is improving, worsening, or unchanged compared to the column on its left. Example:
May-24 should have icon based on comparison with Apr-24
Jun-24 should have icon based on comparison with May-24
Apr-24 serves as the base column without any comparison. In the Pic2, you can ignore <ToFY'23 and FY'24BL column. I can filter-out if required.
Remember:
The Baseline_MonthlyPerf and CompMonths are text data type.
I am new to PowerBI and DAX, hence request if you can provide more detailed steps.