You are using an out of date browser. It may not display this or other websites correctly.
You should upgrade or use an alternative browser.
You should upgrade or use an alternative browser.
Best Chart for the data I have
- Thread starter AthmanArumugam
- Start date
AlanSidman
Well-Known Member
Maybe a speedometer chart

AthmanArumugam
Member
Hi @vletm - Please find atached the data in the chart.It depends ... what do You need ... want to show?
You should able to send an Excel-file with Your data.
Attachments
AthmanArumugam
Member
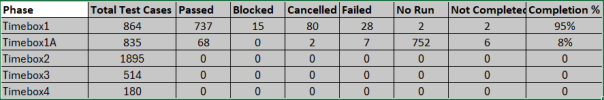
Thanks VLetm for your response. I want to show all the data. I want to show that 737 passed , 15 blocked , cancelled 80, failed 28, no run 2, not completed 2, Overall completion % is 95 for TimeBox1. Similarly The data for other phases . All this information in one chart.
AthmanArumugam
Member
Thanks very much for your response. This chart helps a lot. What is this chart type called. Is it called Two-Dimentional Chart?

AthmanArumugam
Member
I prefer both of them. Thanks very much.