• Hi All

    Please note that at the Chandoo.org Forums there is Zero Tolerance to Spam

    Post Spam and you Will Be Deleted as a User

    Hui...

  • When starting a new post, to receive a quicker and more targeted answer, Please include a sample file in the initial post.

Backlog metric in pivot table

Hello

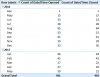
I regularly produce backlog metrics for our customers. See

upload_2017-6-1_14-24-12.png


For long I have run two seperate pivots to calculate opened and closed cases and then combine them here.
I know I can run this as a table by extracting the min date and then counting open closed cases in the range

However I want to do this in pivot table so I can use this for multiple customers and run slicers

upload_2017-6-1_14-48-54.png

I want to run calculated field inside my pivot table to calculate the difference which will give me the difference between the opened-closed

I am counting date opened and date closed field to get number of cases closed and opened in a particular time period.


Regards
 

Attachments

  • upload_2017-6-1_14-48-27.png
    upload_2017-6-1_14-48-27.png
    17.6 KB · Views: 8
Hello Narayan

Thanks for taking the time to look at this

Attached is a sample file. I want to get the backlog and running backlog in my pivot table

Regards
Swati
 

Attachments

  • Sample Workbook.xlsx
    33.4 KB · Views: 23
Hi ,

My knowledge of pivot tables is limited , and what you wanted can possibly be done in a simpler way. I will describe my idea of how it works.

1. The pivot table will return the count of Opened Date and Closed Date , but this is merely a value setting for the field. The base data in these fields are dates , and hence you cannot subtract one from the other.

2. Within the data we need to have a field which has 1 where a valid date is present , and 0 where it is blank. This is the reason for having the two additional columns Count1 and Count2.

3. Once these columns have been added , the pivot table can do a SUM instead of a count.

4. Now we can have a subtraction of Count2 from Count1 , which is what the calculated field Backlog is.

5. We can now have a Running Total which will give us the Running Backlog.

6. If we have the Years and Months as a grouped label , the Running Backlog will reset when 2016 ends and 2017 begins.

To take care of this , a second calculated field of YYYY-MM has been added ; having this as the Row Label ensures that the Running Backlog does not reset when a year ends.

This concept has been explained here :

http://blog.contextures.com/archives/2010/03/03/running-totals-are-easy-with-excel-pivot-tables/

http://www.contextures.com/xlPivot14.html


Narayan
 
Back
Top