All articles with 'VBA' Tag
{ 4 Comments }
Earth Venus cosmic dance – Animated chart in Excel
Published on Apr 25, 2016 in Charts and Graphs, VBA Macros

Recently I saw an interesting Earth Venus cosmic dance video on Facebook. See the original video below or here.
Although this is not entirely accurate from physics & astronomy perspectives, the dance is a stunning example of patterns that are generated by simple things.
I wanted to recreate this cosmic dance in Excel. How else am I to get my spreadsheet fix on a Saturday?
Here is a quick demo of the final outcome. Read on to learn more about the Earth Venus cosmic dance.
Continue »{ 35 Comments }
Advanced Interactive Charts using Excel [Master Class]
Published on Apr 14, 2016 in Charts and Graphs, Cool Infographics & Data Visualizations, Master Class, Pivot Tables & Charts, VBA Macros
As announced earlier, here is the first one of our Master Classes. In this one, you will learn how to create advanced interactive charts in Excel by blending pivot tables, slicers, timelines, VBA, conditional formatting and charts. The final outcome is BEAUTIFUL!!! Monthly Master Class – Episode 1 – Trailer Check out a quick trailer of the […]
Continue »{ 16 Comments }
How to create animated charts in Power Point [VBA]
Published on Mar 17, 2016 in Charts and Graphs, Office Tips
![How to create animated charts in Power Point [VBA]](https://chandoo.org/wp/wp-content/uploads/2016/03/animated-power-point-chart-demo.gif)
This is a guest post by Chirayu, a member of Chandoo.org forum.
Animating Charts in PowerPoint cannot be done without the help of 3rd party software’s that create a flash file of the chart & embed it into the presentation.
However there is a workaround for this. Save your chart as multiple images & insert them (overlapping on top of each other). Use VBA on Developer tab Controls such as Combo Box, Option Button, Check Box etc. to “Bring To Front”” the corresponding image. Thus giving the illusion of an Animated Chart in PowerPoint.
This guide will teach you how to animate the charts, using the three Developer tab Controls that were mentioned before. The code & functionality only works in Slide Show Mode. File must be saved as PowerPoint Macro-Enabled Presentation (*.pptm)
Continue »{ 15 Comments }
“How Trump happened” in Excel [visualizations]
Published on Mar 2, 2016 in Cool Infographics & Data Visualizations, VBA Macros
![“How Trump happened” in Excel [visualizations]](https://chandoo.org/wp/wp-content/uploads/2016/03/how-trump-happened-excel-replica.png)
During last week, an alert reader of our blog, Jørgen emailed me a link to “How Trump happened“. It is an interactive visualization by Wall Street Journal. Jørgen asked me if we could replicate the visualization in Excel. My response: “Making a new chart in Excel? Hell yeah!”
Read on for awesome visualizations and full explanation.
Continue »![Transpose this address data [VBA homework]](https://chandoo.org/wp/wp-content/uploads/2016/01/transpose-address-data-problem.png)
Here is an interesting problem to keep you busy.
Transpose the address data in column A into the format indicated in C:G using either VBA, formulas or Power Query. Once done, post your answers in comments section.
Continue »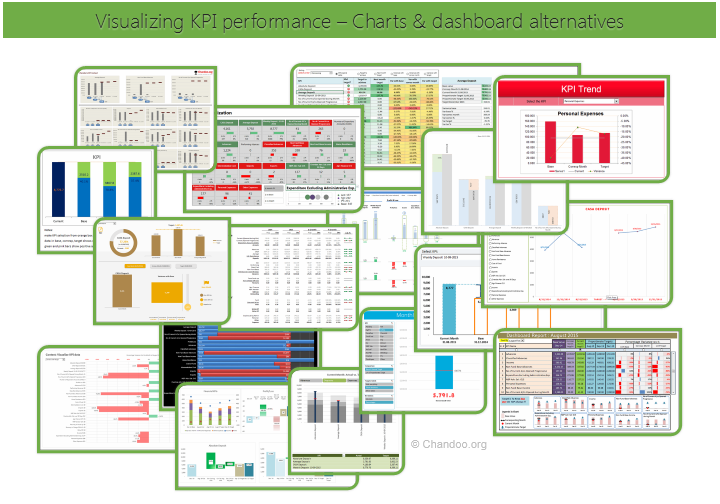
Hello all, prepare to be amazed! Here are 43 creative, fun & informative ways to visualize KPI data.
About a month ago, I asked you to visualize KPI data. We received 65 entries for this contest. After carefully reviewing the entries, our panel of judges have discarded 22 of them due to poor charting choices, errors or just plain data dumps. We are left with 43 amazing entries, each creatively analyzed the data and presented results in a powerful way.
How to read this post?
This is a fairly large post. If you are reading this in email or news-reader, it may not look properly. Click here to read it on chandoo.org.
- Each entry is shown in a box with the contestant’s name on top. Entries are shown in alphabetical order of contestant’s name.
- You can see a snapshot of the entry and more thumbnails below.
- The thumb-nails are click-able, so that you can enlarge and see the details.
- You can download the contest entry workbook, see & play with the files.
- You can read my comments at the bottom.
- At the bottom of this post, you can find a list of key charting & dashboard design techniques. Go thru them to learn how to create similar reports at work.
Thank you
Thank you very much for all the participants in this contest. I have thoroughly enjoyed exploring your work & learned a lot from them. I am sure you had fun creating these too.
So go ahead and enjoy the entries.
Continue »
Podcast: Play in new window | Download
Subscribe: Apple Podcasts | Spotify | RSS
In the 48th session of Chandoo.org podcast, let’s make some animated charts!!!
What is in this session?
In this podcast,
- Announcements
- Why animate your charts?
- Non-VBA methods to animate charts
- Excel 2013’s built-in animation effects
- Iterative formula approach
- VBA based animation
- Cartoon film analogy
- Understanding the VBA part
- Example animated chart – Sales of a new product
- Resources and downloads for you
{ 6 Comments }
Happy Diwali for all our readers – Animated Flower Pot Cracker in Excel for you…
Published on Nov 11, 2015 in Charts and Graphs, VBA Macros

Today is Diwali, the festival of lights. I wish you and your family a happy, bright and prosperous festive time. May your house shower with lots of light, laughter and love.
Diwali is one of my favorite festivals. It is a time when all family members get together, eat delicious food, laugh to hearts content and light up diyas (small oil lamps) to celebrate the victory of good over evil. This year, my kids (who are 6 yrs btw) are very excited about the festival. They are looking forward to lighting up diyas and crackers (fire works).
To celebrate the holiday, I made something for you.
An animated flower pot firework in Excel.
Continue »{ 32 Comments }
Save a range as text file using VBA [tutorial]
Published on Oct 28, 2015 in VBA Macros
![Save a range as text file using VBA [tutorial]](https://chandoo.org/wp/wp-content/uploads/2015/10/save-range-as-text-vba-data.png)
Last night I asked members of our Chandoo.org facebook page to share an Excel problem you are struggling with. Francis asked,
How to save a file as .txt in vba without quotes? When I save as .txt, the file has got quotes inside of it. I used the code Print, but it didnt work because the file loses its delimitation.
Does anyone know how to solve this?
Let’s understand how to save a range as text and overcome the double quote problem.
Continue »{ 5 Comments }
CP047: Best Excel tools for Entrepreneurs
Published on Oct 22, 2015 in Chandoo.org Podcast Sessions, Pivot Tables & Charts

Podcast: Play in new window | Download
Subscribe: Apple Podcasts | Spotify | RSS
In the 47th session of Chandoo.org podcast, let’s see how Excel can make you an awesome entrepreneur.
What is in this session?
In this podcast,
- Why Excel for entrepreneurs
- Key areas of a business owner’s work
- Projects & to dos
- Finances
- Customers & marketing
- Planning & strategy
- Processes & workflows
- 5 features of Excel that help
- Conclusions
{ 3 Comments }
Excel Links – Dashboards book delayed edition
Published on Sep 15, 2015 in excel links
Quick update about Dashboards for Excel book:

Thanks to all of you who pre-ordered this book. I am sorry for this unexpected delay. Just few more weeks and you will be reading it. 🙂
Time for another round of Excel links
Continue »{ 7 Comments }
Build models & dashboards faster with Watch Window
Published on Aug 30, 2015 in Learn Excel, VBA Macros

Here is a familiar scenario: You are building a dashboard. Naturally, it has a few worksheets – data, assumptions, calculations and output. As you make changes to input data, you constantly switch to calculations (or output) page to check if the numbers are calculating as desired. This back and forth is slows you down.
Use Watch Window to reduce development time.
Continue »{ 7 Comments }
CP039: May the FOR Loop be with you – Introduction to For Loops in Excel VBA
Published on Jul 23, 2015 in Chandoo.org Podcast Sessions, VBA Macros
Podcast: Play in new window | Download
Subscribe: Apple Podcasts | Spotify | RSS
In the 39th session of Chandoo.org podcast, Let’s learn about FOR loops.
There is a special giveaway in this podcast. It is a workbook with several FOR loop VBA code examples. Listen to the episode for instructions.

What is in this session?
In this podcast,
- Announcements
- What is a loop – plain English & technical definitions
- For Loop vs. other kind of loops (While & Until)
- For Next loops
- For Each loops
- Nested For loops
- Special tips on For loops
- Performance issues & infinite loops
- Conclusions & giveaway
{ 29 Comments }
Quickly filter a table by combination of selected cell values using VBA
Published on Jul 15, 2015 in VBA Macros

Filtering is one of the most used feature in Excel. It is a quick way to take lots of data and narrow down to the subset we want.
But here is one common filtering scenario that is slow as snail.
Imagine you are looking at some sort of sales data (if you can’t imagine, look at the above demo).
Now, you want to filter this list for gender=male, profession=self-employed, product category = chocolates and quantity = 1.
If you use the right click, filter > filter by selected value approach, this will take several clicks.
Wouldn’t it be cool if you can select the entire combination and say filter?
Unfortunately, no such feature exists in Excel.
But you are not aiming to be ordinary in Excel. You are aiming to be awesome in Excel. That means, you don’t take no for answer.
Fortunately, we can quickly write a VBA macro that filters a list by selection. So let’s do that.
Continue »![]() In about 3 days, I am leaving to USA for participating in PASS Business Analytics conference – 2015. It is an annual event for people in analytics profession. This is the first time I am attending & speaking at the event. I am so excited for many reasons.
In about 3 days, I am leaving to USA for participating in PASS Business Analytics conference – 2015. It is an annual event for people in analytics profession. This is the first time I am attending & speaking at the event. I am so excited for many reasons.
- I will be meeting many Excel bloggers, authors & internet friends for the first time
- I will be meeting many of you (readers, listeners, followers & customers of Chandoo.org) too
- I will be speaking at an awesome conference
- I will be visiting San Francisco for the first time in life
- I will be meeting a few college friends too
All this excitement means, I have too much going on. But that shouldn’t leave you out . So here are a few awesome Excel links for you. Check out and learn.
Continue »
