All articles with 'MS' Tag
{ 3 Comments }
Weekly Excel Links – After a Long Time Edition
Published on Mar 2, 2009 in excel links
In this weeks edition, learn how to compare multiple items in a range using match, know how you can add more than one legend to a chart, include images in comments.
Continue »{ 2 Comments }
How to Change Shapes in Microsoft Office 2007
Published on Feb 25, 2009 in Excel Howtos, Office Tips

Ever since we made a switch to Microsoft Office 2007 at work, this has been bothering me.”How to change one shape to another?”
This is very useful feature, especially when you are using PowerPoint.
Continue »{ 16 Comments }
What is Your Opinion on Pie Charts?
Published on Feb 20, 2009 in Charts and Graphs, Featured
Pie charts are one of the most used charts in the world. And for obvious reasons: they are simple to create and easy to understand. When it comes to pie chart, I have no clear opinion. Part of me says use them, the other says avoid them.
What is your opinion on Pie charts ?
Continue »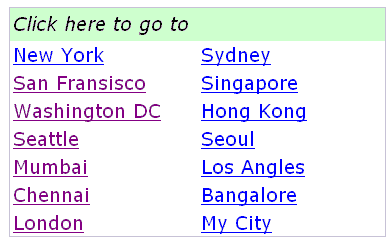
Learn how to create Table of Contents in Excel and other tricks to manage when you have too many worksheets.
Continue »{ 16 Comments }
Excel Colors Somehow Getting Changed ?
Published on Feb 13, 2009 in Excel Howtos, Learn Excel
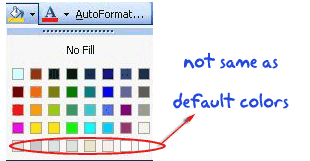
Reader Raja asks about “how he can reset the colors in his workbook”. Read more to find out how you can fix this problem.
Continue »{ 30 Comments }
Make a Dynamic Chart using Data Filters
Published on Feb 12, 2009 in Charts and Graphs, Learn Excel
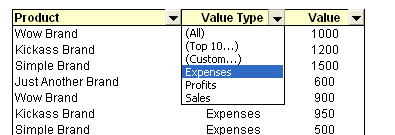
As part of our spreadcheats series, we will learn how you can use data filters to create dynamic charts in Microsoft excel
Continue »
This week, check out the updated excel downloads page and 5 interesting excel articles from around the web. Read more to learn about a mouse trick to paste values, how you can tweet from excel using user forms, an intuitive charting principle and more.
Continue »{ 32 Comments }
Colors in Chart Labels [Quick Tip]
Published on Jan 29, 2009 in Charts and Graphs, Learn Excel
![Colors in Chart Labels [Quick Tip]](https://chandoo.org/img/a/chart-label-formatting-trick.png)
A simple label formatting hack can improve the effectiveness of YoY change charts by adding color to differentiate positive vs. negative growth (or mediocre vs. sky rocketing growth rates). See this example:
Continue »Hurray, PHD blog crossed 2000 RSS Subscriber base. This is a very significant milestone for me.
To celebrate this occasion we have a mega post: 100 Excel & Charting Tips, Tricks and Resources for you.
Continue »{ 32 Comments }
[Reader Poll] Stacked, Seperated or Mirrored ?
Published on Jan 21, 2009 in Charts and Graphs, Learn Excel
![[Reader Poll] Stacked, Seperated or Mirrored ?](https://chandoo.org/img/a/bar-charts-ways-to-stack.gif)
Stacked bar charts are a popular way to depict 2 more series of related data, like sales of 2 products.But there are several ways to stack the bars in a bar chart. Here is a list of 6 ways to stack them
Continue »
9 charting tricks you can use to make your pie charts likable
Continue »{ 40 Comments }
What are the formulas you wish Excel had ?
Published on Jan 13, 2009 in Featured, Learn Excel
Here is a list of formulas I wish MS Excel had. Alas, we need to build some work-arounds to solve them though.
Continue »{ 25 Comments }
Sales Funnel Charts in Excel – Tutorial
Published on Jan 9, 2009 in Charts and Graphs, Learn Excel
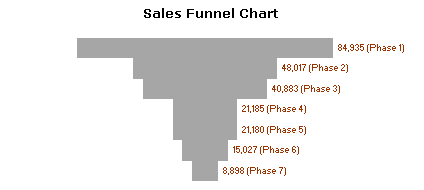
Sales funnel is a very common business chart. Here is a simple bar chart based trick you can use to generate a good funnel chart to be included in that project report.
Continue »{ 175 Comments }
Automatically insert timestamps in excel sheet using formulas
Published on Jan 8, 2009 in Learn Excel

Often when you use excel to track a particular item (like expenses, exercise schedules, investments) you usually enter the current date (and time). This is nothing but timestamping. Once the item is time stamped, it is much more easier to analyze it. Here is an excel formula trick to generate timestamps.
Continue »{ 59 Comments }
Excel Basics – What are Combination Charts and How to Make One?
Published on Jan 5, 2009 in Charts and Graphs, Learn Excel
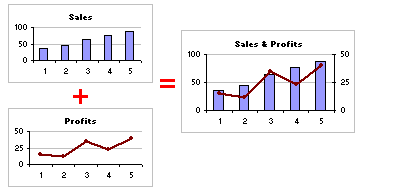
A combination chart is when you combine two different charts to make one. A popular example for combination chart is a line & bar graph combination.
Continue »
