All articles with 'array formulas' Tag
{ 41 Comments }
Free 2014 Calendar, daily planner templates [download]
Published on Jan 2, 2014 in Learn Excel
![Free 2014 Calendar, daily planner templates [download]](https://chandoo.org/wp/wp-content/uploads/2014/01/free-calendar-and-daily-planner-template-2014.png)
Here is a New year gift to all our readers – free 2014 Excel Calendar & daily planner Template.
This calender has,
- One page full calendar with notes, in 4 different color schemes
- Daily event planner & tracker
- 1 Mini calendar
- Monthly calendar (prints to 12 pages)
- Works for any year, just change year in Full tab.
In this episode of Formula Forensics, lets talk about how to build a model where costs vary per year and age. In this example, we are talking about a plantation project. The costs & yields of plants vary by the year they are planted in and the age of plants. In this case, how do we calculate the total costs or returns with formulas?

{ 76 Comments }
What areas of Excel scare you most? [survey]
Published on Nov 1, 2013 in Learn Excel
![What areas of Excel scare you most? [survey]](https://img.chandoo.org/polls/what-areas-of-excel-scare-you-most.png)
Yesterday was Halloween. To our readers who are not familiar with it, ‘Halloween is a colorful festival with lots of costumes, scary stories, theme parties and trick-or-treating, celebrated on 31st October, every year.” I have never celebrated Halloween as it is an unknown tradition in India where I live. But that is no excuse. Especially when the celebration calls for colorful clothes, scary themed houses and shrieking kids.
Of course, we are not going to have a traditional Halloween. Because,
- At our house, we use pumpkins to make sambar, not lights
- The only ones with costumes in our house are my kids.
- If I send my kids for trick or treat, they will get neither.
So that brings us to the only part of Halloween that I can celebrate. Telling scary stories.
So lets talk about the stuff that scares us. But bear in mind that I am not interested in that time when you & your cousin went camping and stumbled in to an abandoned log cabin to discover the …Save it for real Halloween.
We want to talk stuff that scares you in Excel of course.
Continue »{ 89 Comments }
7 reasons why you should use INDEX() formula in Excel
Published on Sep 18, 2013 in Learn Excel

Today lets get cozy. Lets start a fling (a very long one). Lets do something that will make you smart, happy and relaxed.
Don’t get any naughty ideas. I am talking about INDEX() formula.
INDEX?!?
Of all the hundreds of formulas & thousands of features in Excel, INDEX() would rank somewhere in the top 5 for me. It is a versatile, powerful, simple & smart formula. Although it looks plain, it can make huge changes to the way you analyze data, calculate numbers and present them. It is so important that, whenever I teach (live or online), I usually dedicate 25% of teaching time to INDEX().
Enough build up. Lets get cozy with INDEX.
Continue »{ 16 Comments }
Calculating average of every nth value [Formula tips]
Published on Sep 5, 2013 in Excel Howtos
![Calculating average of every nth value [Formula tips]](https://img.chandoo.org/f/average-of-every-nth-value-excel-formulas.png)
Lets say you have a large list of numbers, and you want to calculate the average of every nth value. Not the average of all numbers, but just every nth number.
That is what we will learn in next few minutes.
Continue »{ 28 Comments }
How to find sum of top 3 values based on filtered criteria [video]
Published on May 17, 2013 in Excel Howtos
![How to find sum of top 3 values based on filtered criteria [video]](https://img.chandoo.org/f/sum-of-top-3-values-meeting-filtered-criteria-excel.png)
Lets say you are looking at some data as shown above and wondering what is the sum of budgets for top 3 projects in East region with Low priority. How would you do that with formulas?
Continue »
Last week, we had our very first quiz – “How well do you know your LOOKUPs?”. I hope you have enjoyed it.
Today lets understand the answers & explanations for this quiz.
Continue »{ 49 Comments }
Transpose a table of data using Excel Formulas
Published on Feb 1, 2013 in Excel Howtos
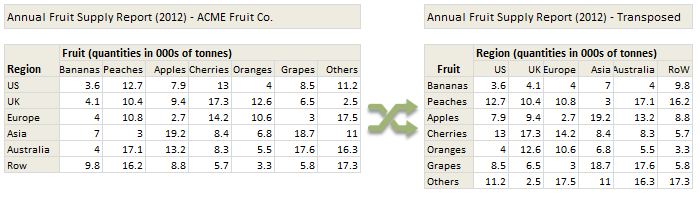
Today lets tackle a familiar data clean-up problem using Excel – Transposing data.
That is, we want to take all rows in our data & make them columns. Something like this:
Learn these 4 techniques to transpose data:
1. Using Paste Special > Transpose
2. Using INDEX formula & Helper cells
3. Using INDEX, ROWS & COLUMNS formulas
4. Using TRANSPOSE Formula
{ 63 Comments }
Can you calculate vacation days in a period? [Homework]
Published on Jan 25, 2013 in Excel Challenges
![Can you calculate vacation days in a period? [Homework]](https://img.chandoo.org/hw/calculate-vacation-days-excel-formula-homework.png)
Its Friday, that means time for another Excel challenge for you.
Calculate vacation days in a period:
Your mission, if you choose to accept it,
Step 1: Download the hom work problem file.
Step 2: Calculate number of vacations taken in a period. Specifically,
1) How many vacations are taken between start & end dates, assuming complete vacation should be inside the start & end date period?
2) How many vacations are taken such that at least one day of vacation is between start & end dates?
3) How many people took vacations? (if same person took multiple vacations, then count it as 1)
![2013 Calendar – Excel Template [Downloads]](https://img.chandoo.org/c/2013-calendar-template-FREE-download.png)
Here is a New year gift to all our readers – free 2013 Excel Calendar Template.
This calender has,
- One page full calendar with notes, in 4 different color schemes
- Daily event planner & tracker
- 1 Mini calendar
- Monthly calendar (prints to 12 pages)
- Works for any year, just change year in Full tab.
{ 229 Comments }
Can you find that pattern? [Homework]
Published on Dec 14, 2012 in Excel Challenges
![Can you find that pattern? [Homework]](https://img.chandoo.org/hw/can-you-find-that-pattern-excel-homework.png)
Are you ready for an Excel challenge?
Today, your job is very simple. Just find a pattern in a text and return corresponding value.
Your Homework:
In a range we have some resource types & their billing rates.
In another range, we have some descriptions. Each description contains a resource type somewhere inside it. We need to retrieve billing rate for each description by looking up which resource type is mentioned in it.
See above diagram.
Continue »{ 53 Comments }
Extract file name from full path using formulas
Published on Oct 23, 2012 in Excel Howtos, Formula Forensics
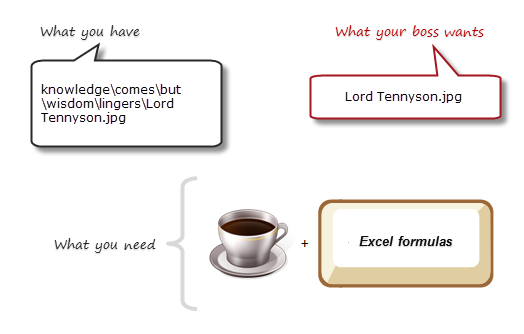
Today lets tackle a very familiar problem. You have a bunch of very long, complicated file names & paths. Your boss wants a list of files extracted from these paths, like below:
Of course nothing is impossible. You just need correct ingredients. I cannot help you with a strong cup of coffee, so go and get it. I will wait…
Back already? well, lets start the formula magic then.
Continue »{ 17 Comments }
Formula Forensics No. 030 – Extracting a Sorted, Unique List, Grouped by Frequency of Occurrence
Published on Oct 4, 2012 in Formula Forensics, Posts by Sajan

Today at Formula Forensics, Guest author Sajan shows us how to extract a sorted, unique list of items, displaying the most frequently occurring items first, while restricting the output based on some additional criteria.
Continue »{ 165 Comments }
Homework: Can you extract dates from text?
Published on Aug 17, 2012 in Excel Challenges, Excel Howtos
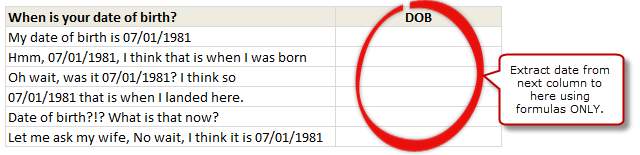
So who is up for a challenge? Can you use only formulas and extract dates buried inside text?
- Download this file.
- In column C, write a formula such that you can extract the date in column B
- If you succeed, post your solution here as a comment.
- If you fail, drink some coffee, start afresh.
{ 22 Comments }
How to make Box plots in Excel [Dashboard Essentials]
Published on Jul 31, 2012 in Charts and Graphs
![How to make Box plots in Excel [Dashboard Essentials]](https://img.chandoo.org/dashboards/bp/box-plot-in-excel-how-to.png)
Whenever we deal with large amounts of data, one of the goals for analysis is, How is this data distributed?
This is where a Box plot can help. According to Wikipedia, a box plot is a convenient way of graphically depicting groups of numerical data through their five-number summaries: the smallest observation (sample minimum), lower quartile (Q1), median (Q2), upper quartile (Q3), and largest observation (sample maximum)
Today, let us learn how to create a box plot using MS Excel. You can also download the example workbook to play with static & interactive versions of box plots.
Continue »
