All articles in 'VBA Macros' Category
![Transpose this address data [VBA homework]](https://chandoo.org/wp/wp-content/uploads/2016/01/transpose-address-data-problem.png)
Here is an interesting problem to keep you busy.
Transpose the address data in column A into the format indicated in C:G using either VBA, formulas or Power Query. Once done, post your answers in comments section.
Continue »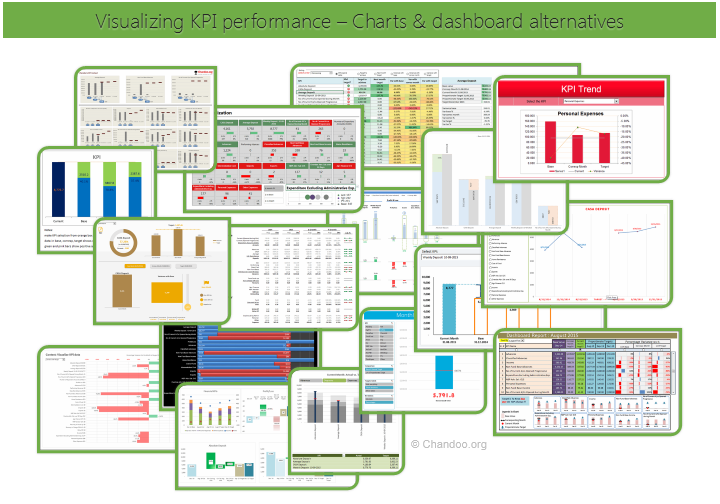
Hello all, prepare to be amazed! Here are 43 creative, fun & informative ways to visualize KPI data.
About a month ago, I asked you to visualize KPI data. We received 65 entries for this contest. After carefully reviewing the entries, our panel of judges have discarded 22 of them due to poor charting choices, errors or just plain data dumps. We are left with 43 amazing entries, each creatively analyzed the data and presented results in a powerful way.
How to read this post?
This is a fairly large post. If you are reading this in email or news-reader, it may not look properly. Click here to read it on chandoo.org.
- Each entry is shown in a box with the contestant’s name on top. Entries are shown in alphabetical order of contestant’s name.
- You can see a snapshot of the entry and more thumbnails below.
- The thumb-nails are click-able, so that you can enlarge and see the details.
- You can download the contest entry workbook, see & play with the files.
- You can read my comments at the bottom.
- At the bottom of this post, you can find a list of key charting & dashboard design techniques. Go thru them to learn how to create similar reports at work.
Thank you
Thank you very much for all the participants in this contest. I have thoroughly enjoyed exploring your work & learned a lot from them. I am sure you had fun creating these too.
So go ahead and enjoy the entries.
Continue »
Podcast: Play in new window | Download
Subscribe: Apple Podcasts | Spotify | RSS
In the 48th session of Chandoo.org podcast, let’s make some animated charts!!!
What is in this session?
In this podcast,
- Announcements
- Why animate your charts?
- Non-VBA methods to animate charts
- Excel 2013’s built-in animation effects
- Iterative formula approach
- VBA based animation
- Cartoon film analogy
- Understanding the VBA part
- Example animated chart – Sales of a new product
- Resources and downloads for you
{ 6 Comments }
Happy Diwali for all our readers – Animated Flower Pot Cracker in Excel for you…
Published on Nov 11, 2015 in Charts and Graphs, VBA Macros

Today is Diwali, the festival of lights. I wish you and your family a happy, bright and prosperous festive time. May your house shower with lots of light, laughter and love.
Diwali is one of my favorite festivals. It is a time when all family members get together, eat delicious food, laugh to hearts content and light up diyas (small oil lamps) to celebrate the victory of good over evil. This year, my kids (who are 6 yrs btw) are very excited about the festival. They are looking forward to lighting up diyas and crackers (fire works).
To celebrate the holiday, I made something for you.
An animated flower pot firework in Excel.
Continue »{ 32 Comments }
Save a range as text file using VBA [tutorial]
Published on Oct 28, 2015 in VBA Macros
![Save a range as text file using VBA [tutorial]](https://chandoo.org/wp/wp-content/uploads/2015/10/save-range-as-text-vba-data.png)
Last night I asked members of our Chandoo.org facebook page to share an Excel problem you are struggling with. Francis asked,
How to save a file as .txt in vba without quotes? When I save as .txt, the file has got quotes inside of it. I used the code Print, but it didnt work because the file loses its delimitation.
Does anyone know how to solve this?
Let’s understand how to save a range as text and overcome the double quote problem.
Continue »{ 7 Comments }
Build models & dashboards faster with Watch Window
Published on Aug 30, 2015 in Learn Excel, VBA Macros

Here is a familiar scenario: You are building a dashboard. Naturally, it has a few worksheets – data, assumptions, calculations and output. As you make changes to input data, you constantly switch to calculations (or output) page to check if the numbers are calculating as desired. This back and forth is slows you down.
Use Watch Window to reduce development time.
Continue »{ 7 Comments }
CP039: May the FOR Loop be with you – Introduction to For Loops in Excel VBA
Published on Jul 23, 2015 in Chandoo.org Podcast Sessions, VBA Macros
Podcast: Play in new window | Download
Subscribe: Apple Podcasts | Spotify | RSS
In the 39th session of Chandoo.org podcast, Let’s learn about FOR loops.
There is a special giveaway in this podcast. It is a workbook with several FOR loop VBA code examples. Listen to the episode for instructions.

What is in this session?
In this podcast,
- Announcements
- What is a loop – plain English & technical definitions
- For Loop vs. other kind of loops (While & Until)
- For Next loops
- For Each loops
- Nested For loops
- Special tips on For loops
- Performance issues & infinite loops
- Conclusions & giveaway
{ 29 Comments }
Quickly filter a table by combination of selected cell values using VBA
Published on Jul 15, 2015 in VBA Macros

Filtering is one of the most used feature in Excel. It is a quick way to take lots of data and narrow down to the subset we want.
But here is one common filtering scenario that is slow as snail.
Imagine you are looking at some sort of sales data (if you can’t imagine, look at the above demo).
Now, you want to filter this list for gender=male, profession=self-employed, product category = chocolates and quantity = 1.
If you use the right click, filter > filter by selected value approach, this will take several clicks.
Wouldn’t it be cool if you can select the entire combination and say filter?
Unfortunately, no such feature exists in Excel.
But you are not aiming to be ordinary in Excel. You are aiming to be awesome in Excel. That means, you don’t take no for answer.
Fortunately, we can quickly write a VBA macro that filters a list by selection. So let’s do that.
Continue »
Learn two techniques to conditionally format the background of a chart based on some external value.
Continue »{ 28 Comments }
Celebrate Holi with this colorful Excel file
Published on Mar 6, 2015 in Charts and Graphs, VBA Macros

Today is Holi, the festival of colors in India. It is a fun festival where people smear each other with colors, water balloons, tomatoes and sometimes rotten eggs. This year we wanted to play with only water guns, but kids vetoed that idea vehemently. So we ended up driving to my sister-in-law’s place to play with colors (there were no rotten eggs or tomatoes, thankfully).
Let me smear a few colors on you
I would love to splash a jug full of color water on you and say Happy Holi. But the internets have not advanced thus far. So I am going to give you the next best option.
An Excel workbook to play holi
Continue »![How to consolidate data that is different shapes [BYOD]](https://chandoo.org/wp/wp-content/uploads/2015/02/consolidating-data-in-different-shapes-excel-problem.png)
Last week, I asked my email newsletter readers to submit “one data analysis problem you are struggling with”. We called it BYOD – Bring your own data. More than 100 people have emailed various interesting (and often very difficult) problems. This week (between 16th of February to 20th of February), let’s take a look at some of these problems and solve them.
Consolidating data in different shapes
We can use either VBA or Excel’s consolidation features to combine data that has same shape (ie same number & type of columns). Here is one way to do it.
But what if we need to consolidate data that is in different shapes?
Something like above.
In such cases, we can use 3 powerful tools.
- Multiple Consolidation Ranges – Pivot Tables
- VBA
- Power Query
So let’s examine how to use these approaches to consolidate data in different shapes.
Continue »{ 40 Comments }
How to check for hard-coded values in Excel formulas?
Published on Jan 14, 2015 in VBA Macros
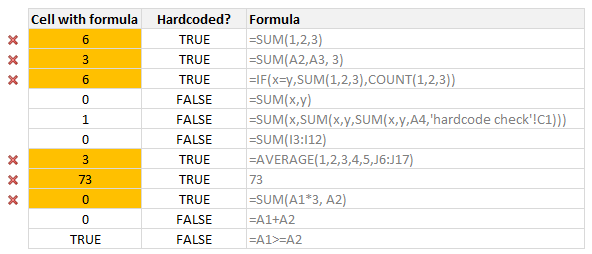
Here is a common problem. Imagine you are looking a complex spreadsheet, aptly titled “Corporate Strategy 2020.xlsx” which as 17 tabs, umpteen formulas and unclean structure. Whoever designed it was in insane hurry. The workbook has formulas like this, =SUM(Budget!A2:A30, 3600)+7925 .
It was as if Homer Simpson created it while Peter Griffin oversaw the project.
So how do you go about detecting all cells containing formulas with hard-coded values?
Continue »{ 39 Comments }
Compare 2 sets of data by letter or word & highlight mismatches [vba]
Published on Dec 15, 2014 in VBA Macros
![Compare 2 sets of data by letter or word & highlight mismatches [vba]](https://img.chandoo.org/vba/compare-2-texts-by-letter-word-demo.gif)
We analysts like to compare. If you ever want to keep an analyst busy, just give her 2-3 options. She won’t return to your desk until the cows come home. My wife uses this trick all the time. Picture this:
[In late 2013]
Me: I want to buy a new phone
She: Do you want Nexus 5 or Galaxy S5 or iPhone 5s?
Its late 2014 and I am not done comparing.
So today, let’s talk about an interesting comparison scenario.
Comparing by letter or word
See above demo to understand the concept. Read more to learn how to do this.
Continue »
Did you know you can Calculate Pi by throwing Frozen Hotdogs !
No ?
Learn how to calculate Pi by throwing Frozen Hotdogs with this Excel Simulation of Buffon’s Needle.
{ 9 Comments }
Looking up when data won’t play nice – few more alternatives
Published on Nov 12, 2014 in Learn Excel, VBA Macros

Recently, we discussed about the case of unwieldy data and how we lookup what we want using formulas like SUMIFS. Today, let us learn few more ways to solve the same problem.
Suitable structure spawns simple solutions
Poorly structured is the 2nd biggest problem of analysts. The first one is not enough coffee. That is why there is a dictum in the data analytics world.
Structure is everything
So, we can easily solve our lookup problem, if our data were to magically re-arranged in 2 column fashion – Data & Value.
Continue »
