All articles in 'Power Pivot' Category
{ 4 Comments }
Power Pivot & Advanced Excel course is open, Join us today!
Published on Feb 6, 2013 in Power Pivot, products

Hello readers & supporters of Chandoo.org,
I am very glad to announce that our newest online class – Power Pivot course is now open for your consideration. In this post, you can understand details about this course & how to join us.
Click here if you are ready to join us. Read below to learn more.
What is Power Pivot course?
These days almost any job requires data analysis & presentation of results. While anyone can put a list of values in Excel & sum them up, not everyone can do advanced analysis, create charts, make them interactive, summarize data intelligently, present output in an intuitive dashboard or slice & dice data using Pivot tables & Power Pivot. Having these vital skills can make you invaluable to your organization & expose you to new opportunities. Not to mention the amount of time, money & effort you can save by efficiently using Excel.
That is why I have created 2 powerful courses – Excel School & Power Pivot Class. Think of these as steps in a ladder.
Continue »{ 4 Comments }
Details about our Power Pivot Course [and a video for those of you not interested]
Published on Jan 30, 2013 in Excel Howtos, Power Pivot
![Details about our Power Pivot Course [and a video for those of you not interested]](https://img.chandoo.org/power-pivot/power-pivot-course-details.png)
Hello folks,
If this article was a person, they would be schizophrenic. You see, it has 2 purposes:
- Give you all the details about my upcoming Power Pivot course
- Give you a solution to last week’s vacation days problem
Details about Power Pivot Course
Power Pivot, an Excel add-in makes it easy to connect, analyze & visualize massive amounts of data. This course aims to teach you how to use Power Pivot to analyze data, create advanced reports & prepare dashboards all from familiar interface of Excel. This is ideal for data analysts, reporting & MIS professionals, business analysts, managers & dashboard makers.
{ 23 Comments }
Introduction to DAX Formulas & Measures for Power Pivot
Published on Jan 28, 2013 in Power Pivot
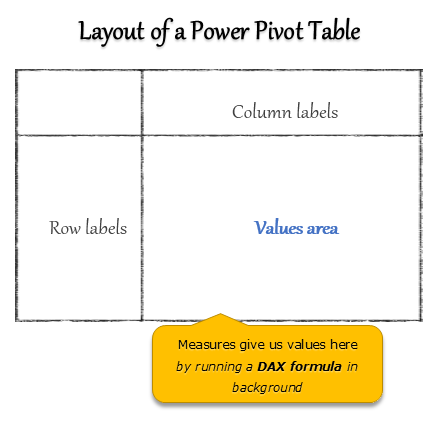
A measure is a formula for the values area of Power Pivot table.
A measure can be implicit or explicit.
Implicit measures are created automatically when you drag and drop a field in to Power Pivot values area. For example, in last week’s introduction, we created an implicit measure for SUM of Sales by dragging and dropping the sales amount field in to values area of our power pivot table.
Explicit measures are created by you using New measure button in Power Pivot tab (or Calculated Field button in Excel 2013 Power Pivot tab). You can also create a measure in the Power Pivot window.
Learn what measures are, how to create them using DAX (Data Analysis Expression) formulas in this video tutorial.
Continue »{ 61 Comments }
What is Power Pivot – an Introduction [video]
Published on Jan 21, 2013 in Learn Excel, Power Pivot
![What is Power Pivot – an Introduction [video]](https://img.chandoo.org/power-pivot/introduction-to-power-pivot-excel.png)
Today, lets talk about Power Pivot & understand it.
What is Power Pivot?
Power Pivot is an Excel add-in to connect, analyze & visualize massive amounts of data..
Lets take a closer look at the definition.
Connect: You can use multiple tables of data & set up relationships between them using Power Pivot. For example, you can connect customer details to sales transactions so that you can summarize sales by customer location or gender easily.
Analyze: You can create simple pivot table style reports or create something exceedingly complex by defining your own calculated fields for values area of the pivot. There is a whole set of formulas defined for exactly this purpose, called as DAX formulas.
Visualize: Instantly filter your reports using slicers, time lines (Excel 2013 or above only), conditional formats, pivot charts etc. You can even define KPIs and see the performance in bands.
Massive Amounts of Data: Although your typical Excel worksheet contains a million rows, if you tried to load even half of those with any data, Excel would quickly become slow & lazy. Power Pivot can take a million rows for breakfast and would be hungry for more. It can processes millions of rows of data very quickly and easily, all from the comfort of a standard desktop or laptop.
Continue »
