So how did your weekend go?
I did a bit of gardening, painted our car shed, played badminton (I am learning), attended 60th birthday of a close friend’s dad. Pretty hectic, but fun as usual.
 To start this week, let me share a simple but fun way to add data to charts.
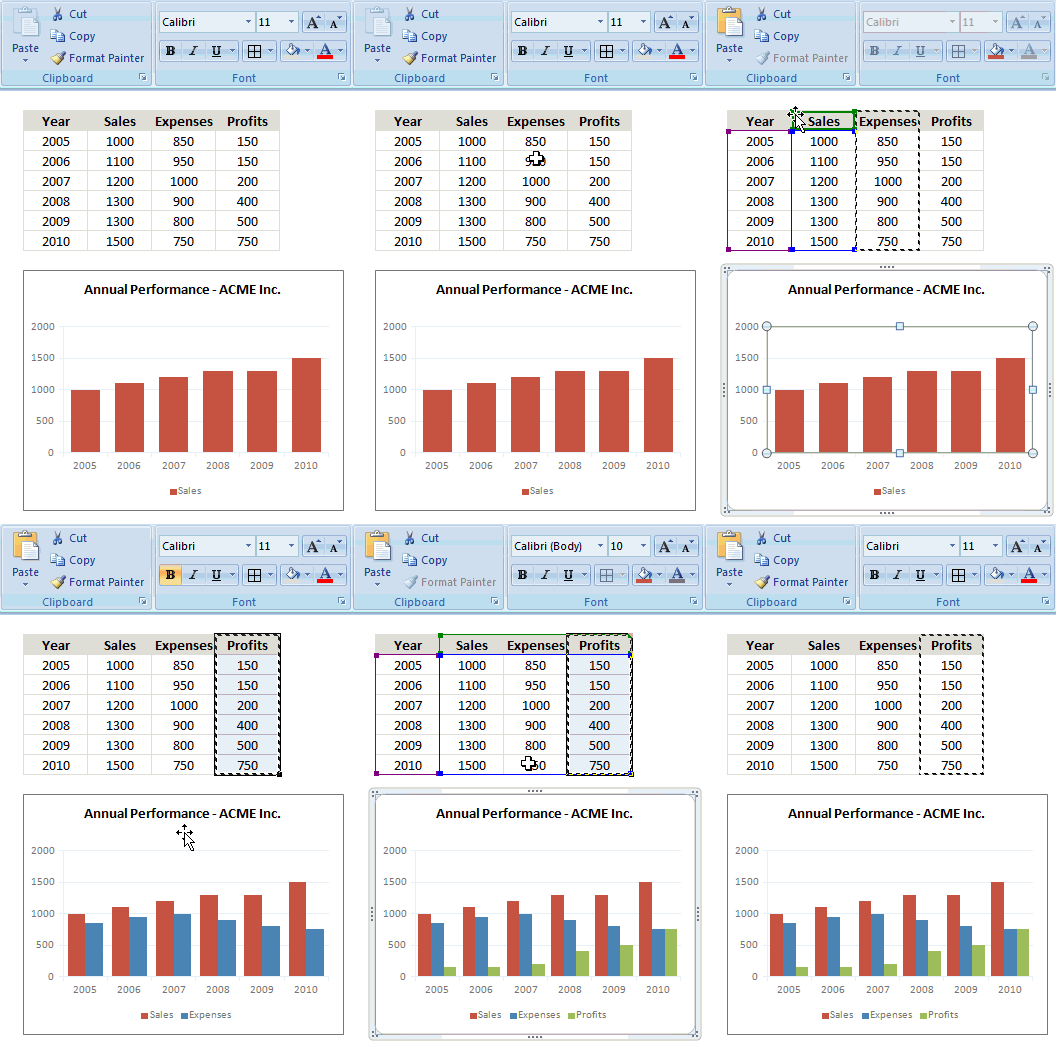
Lets say you have a chart that depicts Annual sales for last few years. And you want to add the data of Profits (or Expenses) to this chart. Here is a dead-simple way to do it.
- Copy the profit data by selecting it and pressing CTRL+C
- Select the chart
- Paste by pressing CTRL+V
- That is all!
See the demo alongside to understand how this works.
Bonus Tips:
- While pasting, if you go for Paste Special (CTRL+ALT+V or ALT+E S) you can tell whether the data should be added as a new series or new points and several other things.
- To remove a series of data from a chart, just select the series and hit DEL key.
- To extend a series (ie add new points to it), select the series. Now you will see that Excel has highlighted the range of cells corresponding to that series. Just point your mouse at the bottom-right corner and resize the range to add new points to the chart.
More Quick Tips on Excel Charting
There are a ton of things you can do in Excel with a click of mouse or press of few keys. Whenever we learn something that is simple yet very useful, we share it as a quick tip. Browse thru these to learn more on Excel Charting.
- Highlight points in line charts & scatter plots
- Display Alert Symbols in Dashboards using Conditional Formatting
- Change Data Labels in Charts to whatever you want
- Use Paste Special to Speed up Chart Formatting
- Hide “0” in Excel Chart’s Axis
- Create a combination chart, add secondary axis
- More Quick Tips & Chart Formatting Tips


10 Responses to “Add Data to Charts with Copy Paste [Quick Tip]”
If your just adding a column that's adjacent to the current chart data range, just drag the corners of the highlighted range (the same technique suggested here for extending a series).
Hi Chandoo,
I found that:
1. Crtl+Alt+V doesn't work on 2007 version. Only Alt+E S works on 2007.
2. when I hi-light the series to be deleted, the whole chart was deleted. I had to double click on one data bar of the series (i.e. specifying just one bar) and hit the Del key to remove the entire series.
@Fred
If you copy the data range you have to include the series name in the series
Then you can select a chart, making sure to select the chart area
Then Ctrl V, will paste a new series of data in based on your copy range
You can't delete just 1 bar you have to delete a whole series
Select the chart then select a series
Press Delete
Hi,
just wanted to tell you, that it's so cool how you show the workaround!
Wow!
Great shortcut! Comes in handy for secondary graphs!
I use this tip since Excel 2003 and I love it! (just a little difference, of course)
I don't like that now we can't use the F4 shortcut in chart format. 🙁
Thanks for your tips!
cool tip
This saves tons of time. Thank you for this article!
h?y there and th?nk ?ou for your info – I have definitely picked up anything new from right ?ere.
I did however ex?e?tise several technical i?sues using this web s?te, since I experienced to
reload the web ?ite a lot of times pre?ious to I could get it
to load co?rectly. I had ?een wondering if ?our web host
is OK? Not that I am ?omplaining, but sluggish loa?ing instances times will often affect your placement in google and could damage your quality scor?
if advertising and marketing with Adwor?s. We?l I am adding
this RSS to my e-mail and can look out for a lot more of your respectiv?
interesting content. Ensure that you update this again very soon.
Thank you!!!