Archive for January, 2010
{ 24 Comments }
What is PowerPivot? (and does it really wear underwear on top of pants !?!)
Published on Jan 8, 2010 in Charts and Graphs

Along with Excel 2010, Microsoft released a free add-in called PowerPivot. According to MS, PowerPivot gives users the power to create compelling self-service BI solutions, facilitates sharing and collaboration on user-generated BI solutions in a Microsoft SharePoint Server 2010 environment, and enables IT organizations to increase operational efficiencies through Microsoft SQL Server 2008 R2-based management […]
Continue »{ 46 Comments }
A New Year Resolutions Template that Kicks Ass
Published on Jan 7, 2010 in Charts and Graphs, excel apps
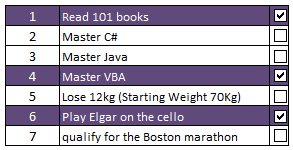
Jennie, a sweet and ambitious lady set out to do 101 things in the next 1001 days. She took the inspiration from Day Zero Project. Not stopping there, she prepared a cute little excel sheet to keep track of all these new year resolutions and sent it to me.
I think this is a swell excel template if you want to keep track of your goals or new year resolutions or just manage a list.
Continue »{ 13 Comments }
Highlighting Repeat Customers using Conditional Formatting [Part 2 of 2]
Published on Jan 6, 2010 in excel apps, Learn Excel
![Highlighting Repeat Customers using Conditional Formatting [Part 2 of 2]](https://chandoo.org/img/n/repeat-customers-excel-conditional-formatting.png)
This is second part of 2 part series on conditionally formatting dates in excel.
Highlighting Repeat Customers using Conditional FormattingIn yesterday’s post we have learned how to conditionally format dates using excel. In this article, you will learn how to use these conditional formatting tricks to highlight repeat customers in a list of sales records.
Continue »{ 187 Comments }
Conditionally Formatting Dates in Excel [Part 1 of 2]
Published on Jan 5, 2010 in Excel Howtos, Learn Excel
![Conditionally Formatting Dates in Excel [Part 1 of 2]](https://chandoo.org/img/n/conditional-formatting-button.png)
This is first part of 2 part series on conditionally formatting dates in excel.
Conditional formatting is a very useful feature in Excel. You can use Conditional formatting to tell excel how to format cells that meet certain conditions. For eg. You can use conditional formatting to show all negative values in a range in red color. Today we will learn how to use conditional formatting to format dates.
Continue »{ 115 Comments }
Sales Dashboards – Visualizing Sales Data – 32 Dashboard Examples & Implementations
Published on Jan 4, 2010 in Charts and Graphs, Featured

Sales reports and dashboards are very common in any company. There are several ways in which you can visualize sales data to understand the trends and sales performance. So in November, I have asked you to visualize sales data using sample data. The visualization challenge #2, sponsored by Zoho Reports generated a huge buzz around the community and fetched 32 incredible entries. The response was so overwhelming that it took me almost 24 hours to write this post. Thanks everyone for participating and making this a huge learning experience for everyone. Personally I have learned several useful dashboard and charting tricks. I will be sharing some of these lessons with all of you in the coming weeks.
Continue »
