hello
can someone share a analytic template of daily data
data are
first row = date
no matter how many rows that we what to follow in this monitoring/
in my opinion calculated data could be :
- month of the date
- week of the month
- week of the year (?)
the file could analyse weekly and monthly trends with graph (dynamically chosen)
it could be great to have also a analytic table with statistical for a defined month of week
mean
min
max
median...
for all datas
and sherry on the cake box blot for the month comparaison
data of the month are values in the first file of course
thanks a lot
best regards
based on that file...
 chandoo.org
can someone share a analytic template of daily data
data are
first row = date
no matter how many rows that we what to follow in this monitoring/
in my opinion calculated data could be :
- month of the date
- week of the month
- week of the year (?)
the file could analyse weekly and monthly trends with graph (dynamically chosen)
it could be great to have also a analytic table with statistical for a defined month of week
mean
min
max
median...
for all datas
and sherry on the cake box blot for the month comparaison
data of the month are values in the first file of course
thanks a lot
best regards
based on that file...
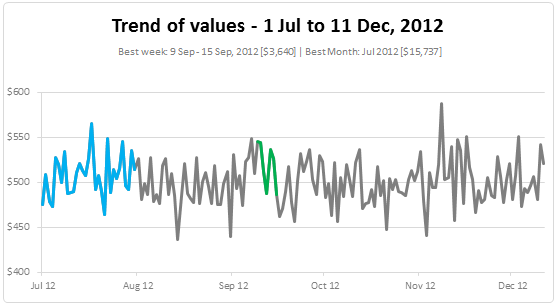
Highlight best week & month in a trend chart [tutorials] » Chandoo.org - Learn Excel, Power BI & Charting Online
When analyzing business data like sales, shop visits or productivity, one of the questions managers always ask is, What is the best month / week for this data? To answer this question, we need to make a chart that looks like above. Today, lets learn how to highlight portions of such charts...
Attachments
Last edited:
