accessAmerica
New Member
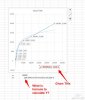
Using a logarithmic trendline (X=# records and y=Cost), I need to calculate the cost for any given Y. Can anyone show me how to do that in excel?!? I have the trendline graph and the trendline formula (y=303.03ln(x)-2120.4), but can't figure out how to covert that to a working excel formula such that I type in Y (# records), it spits out the cost. See attached graph for example.