• Hi All

    Please note that at the Chandoo.org Forums there is Zero Tolerance to Spam

    Post Spam and you Will Be Deleted as a User

    Hui...

  • When starting a new post, to receive a quicker and more targeted answer, Please include a sample file in the initial post.

Not sure where to start

semper5

Member
I am needing a kick start...

I have a chart, product number, and several dates that pertain to each product number.
Its a big chart.

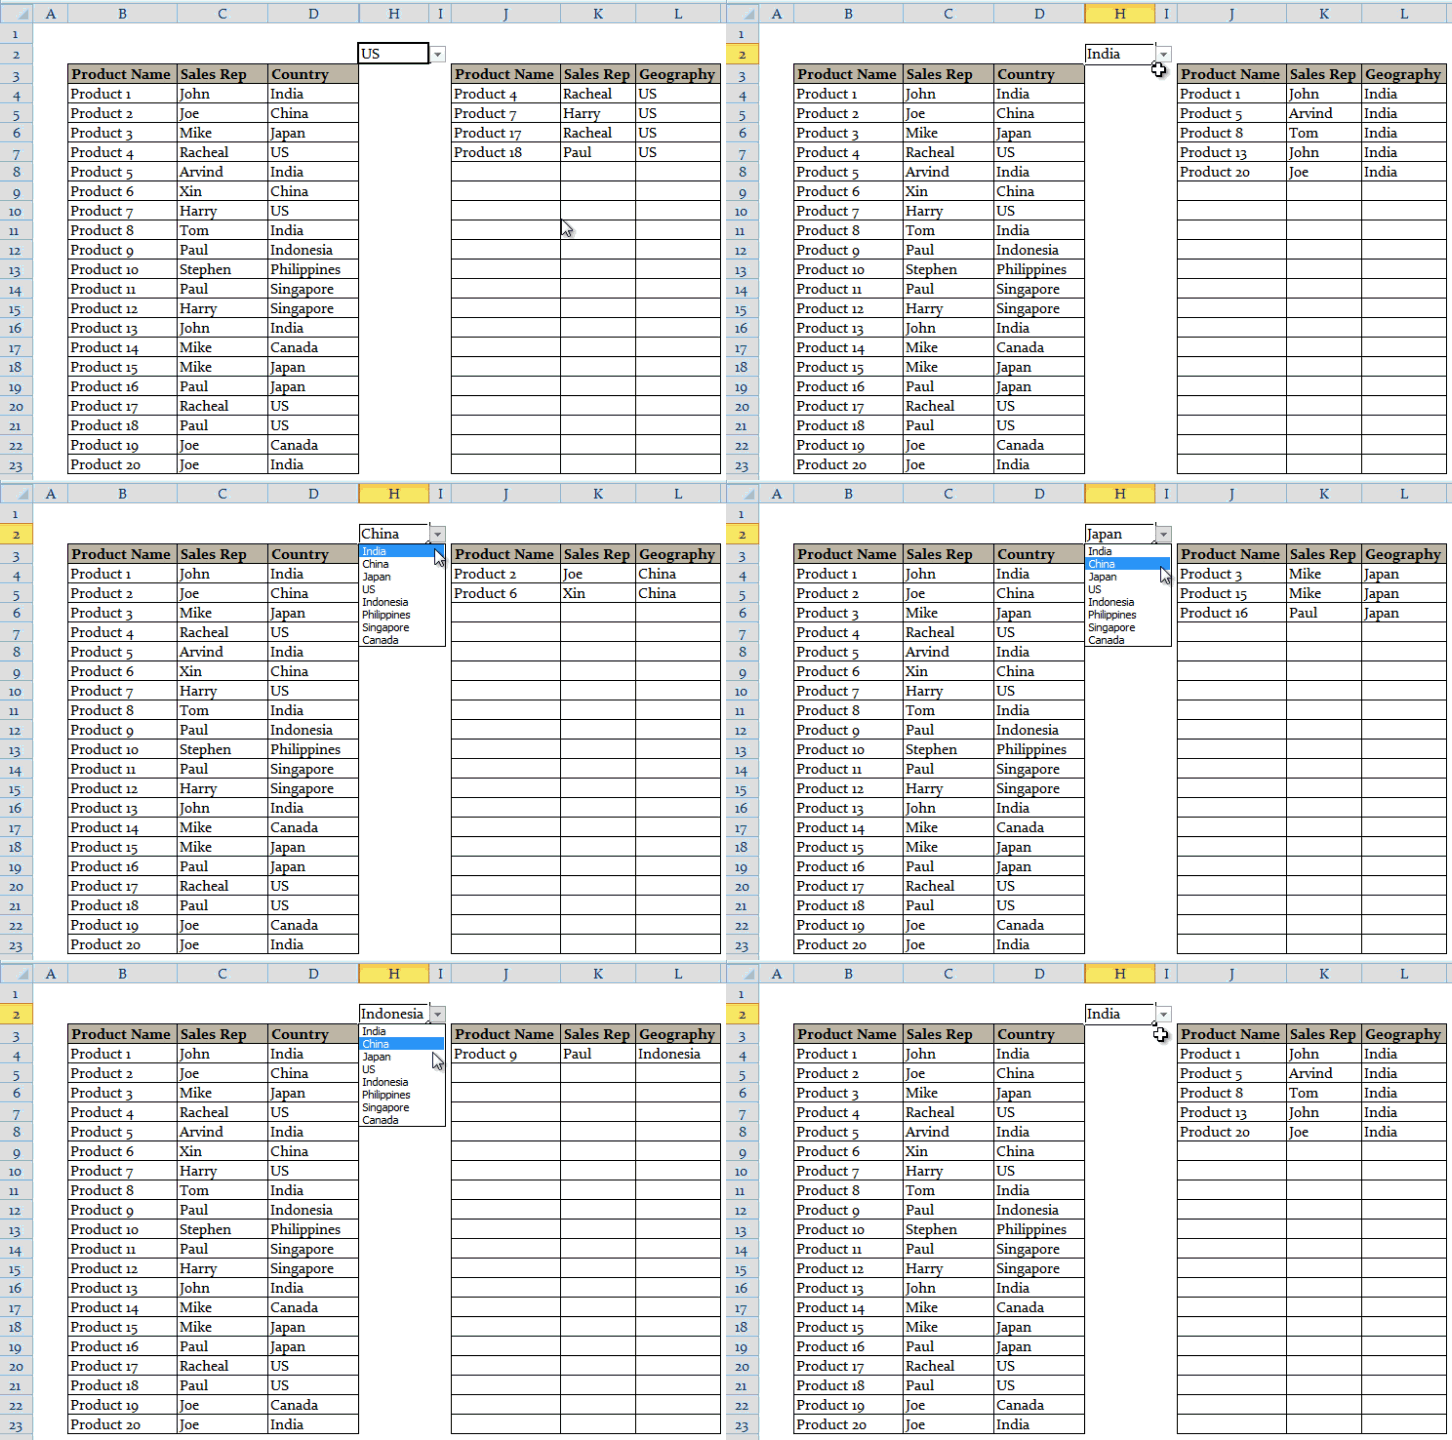
Id like to have a cell, where i can enter the product number. Then, the cells adjacent to that cell would return a few specific dates.
Then, I could delete the product number, enter a new one, and then the same thing would happen.

I'm not sure how to even describe what I am trying to achieve, hence no worksheet attached.

What do I start with?
 
1. First make a manual sub data table of your large data set
2. On that table make the chart you need
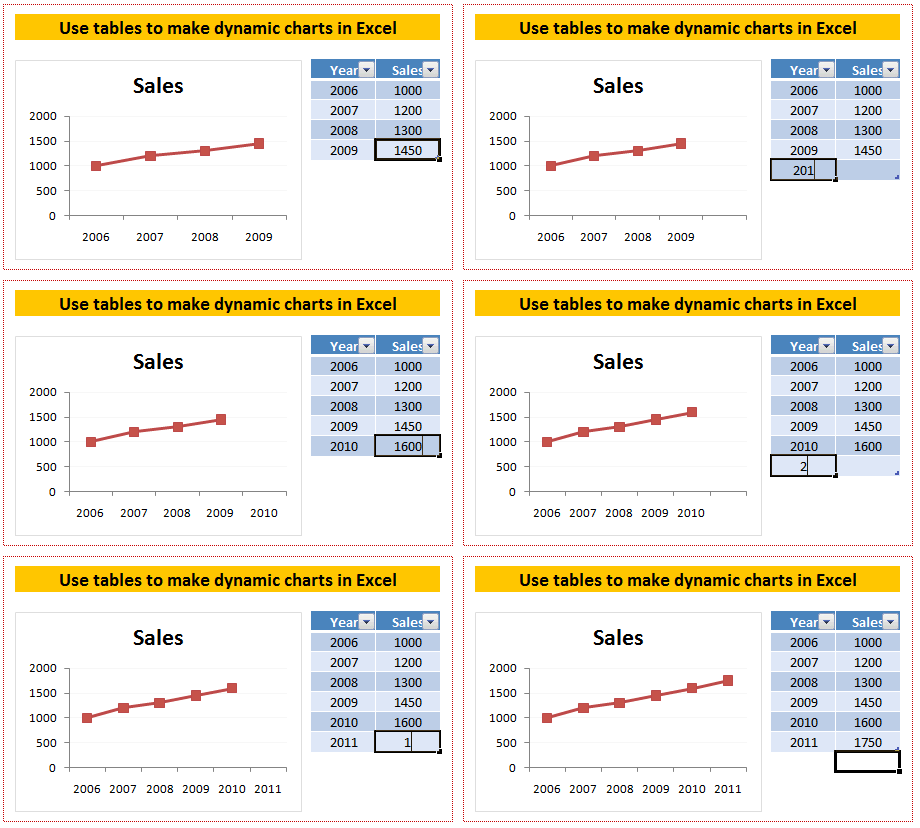
3. Then start building the table based on formulae (check google for filter data with formula and a selection drop down) and update data series to be fully dynamic

Have a look/read of the following
 
See attached sheet;
In Q17, you would be able to enter the complaint number, and then the data that pertains to the complaint number you entered would highlight a different color.
 

Attachments

  • Action Tracking sample.xlsx
    15.1 KB · Views: 4
Hi, could you make a manual example of the chart? Thus for a specific complaint number what you want to see/make obvious on the chart. I don't see/understand it yet.
 
In the cell I have selected 37131, and the blue-highlighted portion is reflective of the complaint number. Had I entered another complaint number, then it would have highlighted the new complaint number entered in similar fashion. does this help?
 

Attachments

  • Action Tracking sample.xlsx
    14.9 KB · Views: 4
59352

Please followed the above indicated Conditional Formatting formula rules and applied ranges.

Regards
Bosco
 
Back
Top