Hi Everyone,
I am new and learning VBA for analysis report (a hundred thousand data).
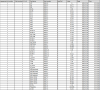
I want to import from text file to excel and want the desired table result as below that it easy for me to generate a chart for analysis.
I also attached a text file. Need your help and teach me on how to make it this data because doing manually will takes time in adding the sequence/unit number.
where shown on text file:
100,X.X - Test Number (like 100,1.0 up to 100,7.6)
"P" - Test Result (P/F)
xxxxxxx - last characters are the Test Value (0.577 ; -4.628 ; 100.006)
130 - means this is the Final result by sequence/unit number
130,1,"01/26/2022 02:18:21","1","P",,,1,1,0,1,
Final Result, Site number,"Date Time","sequence/unit number","Test Result(P/F)",,,HBin number,SBin number,0,1,
Thank you in advance for any input.
I am new and learning VBA for analysis report (a hundred thousand data).
I want to import from text file to excel and want the desired table result as below that it easy for me to generate a chart for analysis.
I also attached a text file. Need your help and teach me on how to make it this data because doing manually will takes time in adding the sequence/unit number.
where shown on text file:
100,X.X - Test Number (like 100,1.0 up to 100,7.6)
"P" - Test Result (P/F)
xxxxxxx - last characters are the Test Value (0.577 ; -4.628 ; 100.006)
130 - means this is the Final result by sequence/unit number
130,1,"01/26/2022 02:18:21","1","P",,,1,1,0,1,
Final Result, Site number,"Date Time","sequence/unit number","Test Result(P/F)",,,HBin number,SBin number,0,1,
Thank you in advance for any input.