Hi All
Using power bi for visualisation
my data has 3 sales person (a,b,c) are selling diffrent choclate types (c1-c7).
first visualisation is based on sales person and second visualisation is based on choclate type.
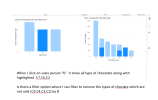
Issue is when i am trying to filter by sales person (sales person B) the second visulisation is showing the bars which are empty.
Sales person B sold only choclate types C7,C2, C5
Choclate type C1,C3,C4,C6 are not sold by B is there a way to remove the blanks. I tried to click on the 2nd visualisation graph and use filters option to show choclate type which are not empty or blank but i still see the empty bars
which / what should i use in the filter so that when i click on B i could see choclates sold by B in second visualisation
Using power bi for visualisation
my data has 3 sales person (a,b,c) are selling diffrent choclate types (c1-c7).
first visualisation is based on sales person and second visualisation is based on choclate type.
Issue is when i am trying to filter by sales person (sales person B) the second visulisation is showing the bars which are empty.
Sales person B sold only choclate types C7,C2, C5
Choclate type C1,C3,C4,C6 are not sold by B is there a way to remove the blanks. I tried to click on the 2nd visualisation graph and use filters option to show choclate type which are not empty or blank but i still see the empty bars
which / what should i use in the filter so that when i click on B i could see choclates sold by B in second visualisation