memot
New Member
Hello,
I have a scatter chart with X and Y axis values. And i need a trendline on it, but the problem is excel decides the curve of the trendline, i want to determine the curve. How could i do that?
y=mx+z (i want to determine the "m" manually.
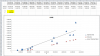
I am also attached the example chart, on this chart i need my linear trendline's gradient must be 0.148608.
Thanks
I have a scatter chart with X and Y axis values. And i need a trendline on it, but the problem is excel decides the curve of the trendline, i want to determine the curve. How could i do that?
y=mx+z (i want to determine the "m" manually.
I am also attached the example chart, on this chart i need my linear trendline's gradient must be 0.148608.
Thanks